WorkoutEvaluator: An iOS App That Provides Personalized Exercise Feedback Through User-provided Data
A well-researched student project. Like very.
Introduction
Background
This Senior Comprehensive Project aims to address the problem within the fitness domain. Specifically, the lack of accessible, personalized feedback in weightlifting training. Millions of people visit gyms each day to improve their health and performance, yet many struggle to determine whether they are training effectively. Questions such as “Am I using the right form?”, “How much weight should I lift?”, “Is my progress on track?”, often goes unanswered without a personal trainer or advanced tracking. To bridge this gap, my iOS application provides real-time, user-input data-driven feedback designed to guide.
The gym lifestyle has been actively growing for over twenty years. In 2000, around 32.8 million people had active gym memberships in the United States. Since then, that number has more than doubled to approximately 77 million in 2024, with predictions estimating 85–90 million memberships by 2030 ([Kerxhaliu?]). As the number of gymgoers continues to rise, so does the portion of this population seeking feedback, whether through phone applications, personal trainers, or wearables. Currently, about 29% of gymgoers work with personal trainers ([Kerxhaliu?]). However, the average hourly rate for a professional personal trainer ranges from $40 to $70 ([6]), which can significantly increase the cost of maintaining a fitness routine. What if there were a way to provide this guidance in a simple, free iOS app on your phone?
In this day and age, almost everyone carries their smartphone wherever they go. Whether it be to work, to dinner, to their children’s soccer games or to the gym. This constant presence presents a unique opportunity: Fitness guidance and feedback can be delivered directly to users’ hands at any time and from anywhere. By leveraging this accessibility, an app can provide personalized, real-time feedback that would complete something that hasn’t neccesarily been completed. In 2024, fitness apps were downloaded a total of 850 million times, yet only 345 million people actively used them ([2]). This gap highlights a clear opportunity for apps that not only attract users but also maintain engagement by delivering meaningful, easy-to-access insights. My iOS application aims to fill this gap, offering concise and actionable workout guidance that keeps users motivated and informed without requiring additional cost or equipment.
This raises the problem that I am driving to solve. Can feedback and analysis be provided to users through a simple and concise free mobile iOS application?
Overview of WorkoutTracker Application
This project includes a working iOS application with all core components implemented. This app is made from three main ideas: workout progress tracking, providing evaluation and feedback, and local data storage.
Workout progress tracking consists of two different areas. Primarily is the concept of logging your workout. In my app, the goal is to keep it simple, taking in user-inputted data that consists of muscle group, exercise, weight, and repetitions. Logging these four things in my developed app takes the user under fifteen seconds. This is beneficial as it provides the user with the ability to input data directly after a completed set, which doesn’t take up minutes. Once the user inputs the data, it then gets shot to two different areas: the workout log and visuals. Once the user inputs the data, they can readily view this within their history log of workouts, providing the user with the information they provided along with the date that it was completed. This is one way that the user will be able to visualize all the different exercises they have completed on any given day. From there, it activates the other visual part that is emphasized. The user is able to see the data for any specific exercise they have entered. This will aid the user in discovering trends and progress. You can easily view and recognize if you are bench pressing more weight than last time and how much it has progressed in the last month. The visuals are a large emphasis of this project, being able to provide the user with a simple and easy way to visualize if they are progressing or regressing goes a long way in the scope of fitness apps.
Providing evaluation, in my opinion, is the main emphasis of this project. With regards to the fitness app realm, no app that can provide concise and specific feedback to aid the user in their gym journey. In my opinion, too much feedback or too complicated feedback can be off-putting for users for many different reasons. Lots of apps provide the user with ten different graphs or ten different data points that stand out, but a lot of the time, the user may not understand what they are looking at and receiving. There has to be a way to provide the user feedback in two to four bullet points that can help them recognize what is good and what is bad, so that they don’t get stuck in a loop of creating bad habits. Well, essentially, this is what my app will have that will stand out. For example, if the user inputs exercises of a certain muscle group more than two to three times a week, my app will tell the user that they are overtraining that muscle group. The basic science is that every time you use a muscle group, you are essentially creating micro tears in this muscle that need time to regrow bigger and stronger. If it does not get that time to rest and regrow, then essentially, you will not see any progress. Things like this are not common for new gymgoers to know, so why not aid them in this journey? This evaluation will also be able to look at and evaluate trends. In the last month, am I progressing or regressing? Well, my app will let the user know this immediately after a data entry. Providing this feedback, in my opinion, is the missing puzzle piece in the fitness industry.
Finally reaching the point of local data storage is an important milestone in developing my app. Local storage allows the app to save information directly on the user’s device, which is essential for reliability, performance, and user experience. It does this by saving a JSON file on the user’s device. A JSON file (JavaScript Object Notation) is a format used to store and organize data in a structured way using key-value pairs. It’s easy for both humans to read and computers to process, making it ideal for app development. In my iOS app, a JSON file can store information such as workouts, exercises, or personal records locally. This helps keep the app’s data organized and easily accessible for future use or syncing. By storing data locally, users can still access and record their workouts even without an internet connection, making the app functional anywhere, including gyms or areas with poor service. It also ensures data persistence, meaning user progress and personal records are saved between sessions instead of being lost when the app closes. Additionally, local data storage enhances performance because retrieving information from the device is much faster than communicating with a remote server. Lastly, it supports better privacy and security, since sensitive fitness data remains on the user’s device, giving them greater control over their personal information. Security in 2025 is more important than ever, as data breaches and hacking attempts have become increasingly common. By prioritizing secure data handling within my app, users can feel confident that their personal information is protected. This added layer of security helps build trust and provides peace of mind while using the app.
The app was developed using Xcode and is currently tested directly on my iPhone through Developer Mode. My primary focus at the beginning of the process was learning a new programming language, Swift, while also understanding how to code, commit, and push changes to a GitHub repository within this new environment. Although Xcode took some time to get comfortable with, trial and error combined with YouTube tutorials—especially those focused on Swift basics, SwiftUI interface design, and Xcode project setup—helped me progress quickly. Comparing Swift to Python also gave me valuable insight into how each language handles certain functions and where Swift performs better for iOS app development.
I leveraged SwiftUI for the interface and used environment objects for data handling. The project was managed through GitHub, ensuring version control and consistent code saving. Testing on my personal iPhone required enabling Developer Mode, registering my device with Xcode, and configuring the necessary provisioning profiles to allow the app to run outside the simulator.
Xcode also provides the option of using “simulators” to run and test apps in development. A simulator is a software tool that mimics the behavior of an actual iPhone or iPad on your computer, allowing you to see how your app would look and function without needing a physical device. However, the downside is that the app may look or behave differently on a real iPhone. Therefore, testing on a physical device was essential to ensure accurate appearance and functionality.
Personal Motivation: “Why Me? Why This Project?”
This project aligns closely with my personal and academic interests in health technology and mobile app development. I have always loved video games, and as I got older, I became interested in understanding how they work behind the scenes. This project allowed me to finally explore that process and develop my own application from the ground up. I am also deeply passionate about health and wellness, so being able to bridge the gap between fitness and software development feels both meaningful and exciting. It represents a step toward creating technology that not only functions well but also has a real impact on people’s daily lives.
I have been an athlete my whole life, from my earliest years through college. I played soccer as soon as I could walk and run, continued with tennis up until my junior year of college, and have tried just about every sport imaginable. Sports have always been a central part of my life, keeping me active every day, whether through clubs or just playing with friends. This routine changed during my junior year of college when I left the Allegheny College Men’s Tennis Team due to a lingering shoulder injury. After playing sports my whole life, it felt strange not to be actively involved in a sport or hobby. To stay active, I decided to pursue a consistent gym lifestyle, going five to six days a week. Thankfully, I already had some experience in the gym through teams and clubs, but without that foundation, I would have had no idea where to start or how to define “success.” Through trial, learning from friends, and watching YouTube tutorials, I gradually gained knowledge and confidence in the gym. That experience sparked the idea: what if there was an app that could track my progress while providing personalized feedback to help me stay on track? I began experimenting with fitness apps like Whoop, Strong, Fitbod, and Hevy, but none provided exactly what I was looking for. That gap inspired me to develop my own app, tailored to my fitness goals and workflow. This process is especially unique because I am both the developer and a user of the app. Being able to experience the app firsthand allows me to constantly evaluate features from a real-world perspective, ensuring usability, simple design, and functionality. This dual role enables me to iterate quickly and create an application that is both practical and engaging for users like myself.
This process is especially unique as I am the developer for this app as well as someone who will be a user for this application. This unique experience allows me to have a visual of what I want to create at all times of development.
This background is why I feel particularly well-qualified for the developer role on this project. My academics at Allegheny College’s CIS department have also provided me with a strong foundation in computer science, equipping me with the technical knowledge and problem-solving skills needed to successfully design and implement a mobile application. Over the course of my studies, I have taken courses across nearly every area of computer science, including software engineering, web design, computer security, and programming languages. This breadth of exposure has allowed me to gain hands-on experience with multiple coding languages and frameworks, giving me the ability to approach the technical challenges of app development.
Two courses, in particular, have shaped my ability to contribute effectively to this project: Software Engineering and Web Design. Software Engineering provided me with experience in professional development workflows, including collaborative sprints, version control, and team-based problem solving. I learned how to write code that is not only functional but also readable and maintainable by other team members, which is a critical skill for any large-scale project. Understanding each function and code block in depth allows me to confidently iterate and expand the app while avoiding errors. Web design, meanwhile, highlighted the importance of user interface and user experience. Developing a clean and visually appealing interface is crucial for engaging users, particularly in a mobile app where ease of navigation and clarity are essential. The lessons from this course ensure that the app I am building is not only technically advanced but also user-friendly.
Beyond my academic preparation, my personal experiences have shaped my motivation and insight into this project. As a lifelong athlete, I have spent countless hours understanding training, fitness, and performance, which gave me firsthand knowledge of what users look for in a health and fitness app. Transitioning from organized sports to independent gym training revealed a gap in available tools for tracking and improving personal fitness progress. By combining this personal experience with my technical expertise, I can create an application that addresses real user needs.
Overall, my combination of technical training, practical experience, and personal motivation provides a strong foundation for this project. I am confident in my ability to develop an engaging and functional app that bridges the gap between software technology and health and wellness.
Project Motivation
This project is driven by the goal of combining key areas of computer science, data analysis, and mobile system integration to create a functional and efficient fitness technology solution. It provides practical experience in app development, data integration, and skills that are valued in the modern technology industry. Through the development of a mobile application that collects, processes, and evaluates the data, the project simulates the type of real-world problem-solving encountered in software engineering and health technology fields.
This project is also motivated by the integration and correlation of scientific and technical principles to advance personal fitness through mobile app development. It applies core STEM disciplines of data evaluation, computer science, and software engineering to design and implement an iOS application that automatically takes in user-inputted data and provides concise feedback.
Science and data represent one of the most direct connections between this project and STEM disciplines. The iOS application collects user-inputted fitness data and performs automated analysis to interpret and present this information meaningfully. The collected data is utilized in multiple ways, primarily for evaluating user performance and progress over time. By processing the data into both structured logs and dynamic visualizations, the app enables users to identify trends, track new personal records, and observe progression or regression across various metrics. Data analysis plays a key role for both the user and the backend system. Users interact with visual representations such as graphs to clearly view their performance history and identify patterns, while the backend continuously updates and organizes the dataset to support accurate and real-time insights.
Technology and engineering also play a heavy role in this project. The concept of building and developing a mobile app with real-world functionality demonstrates the practical application of engineering principles in software design and system development. The project involves using Apple’s development ecosystem, including Swift, Xcode to create an efficient mobile app. Through these tools, the app integrates user interfaces, local data storage, and data analysis. From an engineering standpoint the project requires consistent testing and debugging to ensure complete functionality and accuracy. These processes mirror the real-world design cycle. This involves designing solutions, implementing systems, and refining them based on testing. By applying these principles within this current project, it reinforces the integration of technology and engineering.
This project contributes to the broader field of public health and fitness engagement by allowing users to take an active role in understanding and improving their gym-self. Through user-inputted data-driven insights and personalized analytics, the iOS application encourages consistent use and progress tracking, making health more accessible and engaging. By visualizing performance trends and progress over time, users can make informed decisions about their fitness routines and lifestyle habits. This approach promotes a stronger connection between personal data awareness and long-term health outcomes. Data has shown that consistent exercise provides a variety of benefits that include strengthening bones, positive effects on mood, and even helping to prevent chronic illnesses like diabetes and heart disease (Ahmed). Knowing this, the ability to quickly and freely track progress is something that creates benefits, even outside of benching more wight than last month.
In addition to promoting user engagement, the project addresses critical considerations surrounding data privacy and security. Seemingly, these days, data privacy and security are a growing topic. We are seeing more and more mobile devices contracting online viruses from phishing emails or users clicking faulty links. But specifically regarding data privacy, the importance of handling data leaks is emphasized.
The target audience for this project includes individuals who are seeking to learn more about their fitness habits and gain experience with technology-assisted self-improvement before committing to more advanced or intensive programs. By combining accessibility, automation, and educational value, the application serves as a bridge for users looking to develop a deeper understanding of their health through technology. In 2024 alone, the number of data compromises in the United States was 3,158, which is only 1% under the record number of compromises tracked within one calendar year (Identity Theft Resource Center). This emphasizes the importance of local data storage for this project. All the data that a user has within the application is directly stored on the user’s mobile device. This significantly reduces exposure to potential data breaches and ensures that sensitive information remains under the user’s direct control.
Ethical Implications
Several ethical considerations that need to be acknowledged and talked about for this senior comprehensive project. A few things that are important to talk about are data security, bugs and false user recommendations. Addressing these concerns will provide context for the reasoning behind why I created what I did and how.
First, it is important to acknowledge the user of personal data. This is an open mobile application that could receive a large number of users; it is important to note the use of their data. As the developer of this application, I have no access to the information that the users put into their profiles. This data is securely stored within their mobile device and nowhere else. There is no possibility of data sharing within the app, which creates no possibility of a breach of data. I acknowledge that other apps provide users with the ability to share data with friends or communities within the app. While further researching this concept, I decided that it would be a better and safer solution to solely keep the data for the user’s use only. While there are benefits to communities and friends within an app like this to be able to compare data with friends and communities, the idea of users’ data being jeopardized is a much more serious matter to be addressed. This concept plays into the idea of why I am developing my experiment in this specific fashion.
At first, I thought it would be much more beneficial to conduct an experiment utilizing colleagues to gather responses based on their use of the app and how it helped them progress in the gym. While this experimental idea had its benefits, it had many different ethical implications that had to be considered. I decided to avoid these implications by developing the idea of testing the app through AI-generated data. This experiment will provide me with all the information that I desire in a way that does not conflict with any ethical considerations. This brings me to another thought: what if my evaluation could steer a user in the wrong direction?
As this application has an emphasis on feedback to the user to aid them in their gym journey, is it possible that a false recommendation could have implications on their mindset? This is important to note and look further into. Once a user inputs their data, they then receive certain feedback within the evaluation page depending on their data. This feedback may range from letting the user know that they have exercised a muscle group too many times this week to you did twelve reps; maybe try upping the exercise weight to stick to a rep range of six to ten. As this experiment is provided to the user it may provide the user with new knowledge that could change how they approach their workout. It is critical to know that the app is a tool to supplement informed decision-making rather than a substitute for professional advice. By acknowledging the limitations of data-driven models, the application promotes responsible use and encourages users to interpret their feedback as well as combine it with personal judgments.
Even with careful development and testing, the code may contain bugs or unexpected behaviors that could impact the user experience or the accuracy of the data analysis. In the context of a fitness application, such bugs could lead to incorrect feedback, misrepresented progress, or failure to update the user’s personal records. For example, a calculation error could suggest that a user has reached a personal record when they have not, or fail to warn them about overtraining a muscle group. From an ethical perspective, acknowledging and mitigating the risks of bugs is essential. This includes rigorous testing and providing mechanisms for users to report errors or inconsistencies. By planning for potential software errors and maintaining transparency, the application prioritizes user trust, safety, and well-being.
As there are many ethical implications to consider within this application, I have developed this application in a specific fashion to avoid many possible ethical issues. These include local storage of user data to ensure privacy, conducting an experiment that handles AI-generated data instead of dealing with human data, acknowledging the fact that this app may provide a false recommendation due to model limitations, and proactively testing the code to avoid the possibility of bugs arising.
Structure of Senior Comprehensive Project
This project is organized into five chapters. Chapter one introduces the project, including its professional and technical motivation, relevance to STEM disciplines, ethical considerations, and overall structure. Chapter two reviews related works and literature, compares similar applications, and provides the technical context. Chapter three describes the methods used in developing the iOS application, including system design, code architecture, and UI/UX decisions. Chapter four presents experimental results, including testing outcomes, user feedback, data validation, and performance evaluation. Finally, Chapter five discusses the results, highlights potential improvements, explores broader applications, and suggests directions for future research. This structure ensures a clear and logical presentation of the project from conception to evaluation and implications.
Contributions of The Project
This project contributes a custom iOS application that integrates workout tracking, data analysis, and personalized feedback within a unified, simple, user-friendly mobile platform. Unlike other fitness applications, this system is tailored to individual user-inputted data and emphasizes the interpretation of the data rather than just simple data logging and visuals. This application includes six seperate pages that are key in acknowledging history, charts, evaluation, awards, and the user profile view.
This includes the development of a local user login and account creation system and an entirely device-based data storage model built in Swift. This creation demonstrates the importance of local data storage within my application. As discussed before, preventing data leaks is the #1 reason behind the local storage.
The main landing page, once the user has logged in, is the history or workout log page. This page contains all the specific exercises the user has completed. Once a user inputs their data for an exercise, including weight, repetitions, and muscle group, this data will show up within the history page along with a date. The workout log is an essential piece of content to include when creating a fitness app, as it allows users to rewind in time to see their past data. Keeping this page simple is also important because as this page gets more complicated, it may complicate the user’s ability to easily view past workouts.
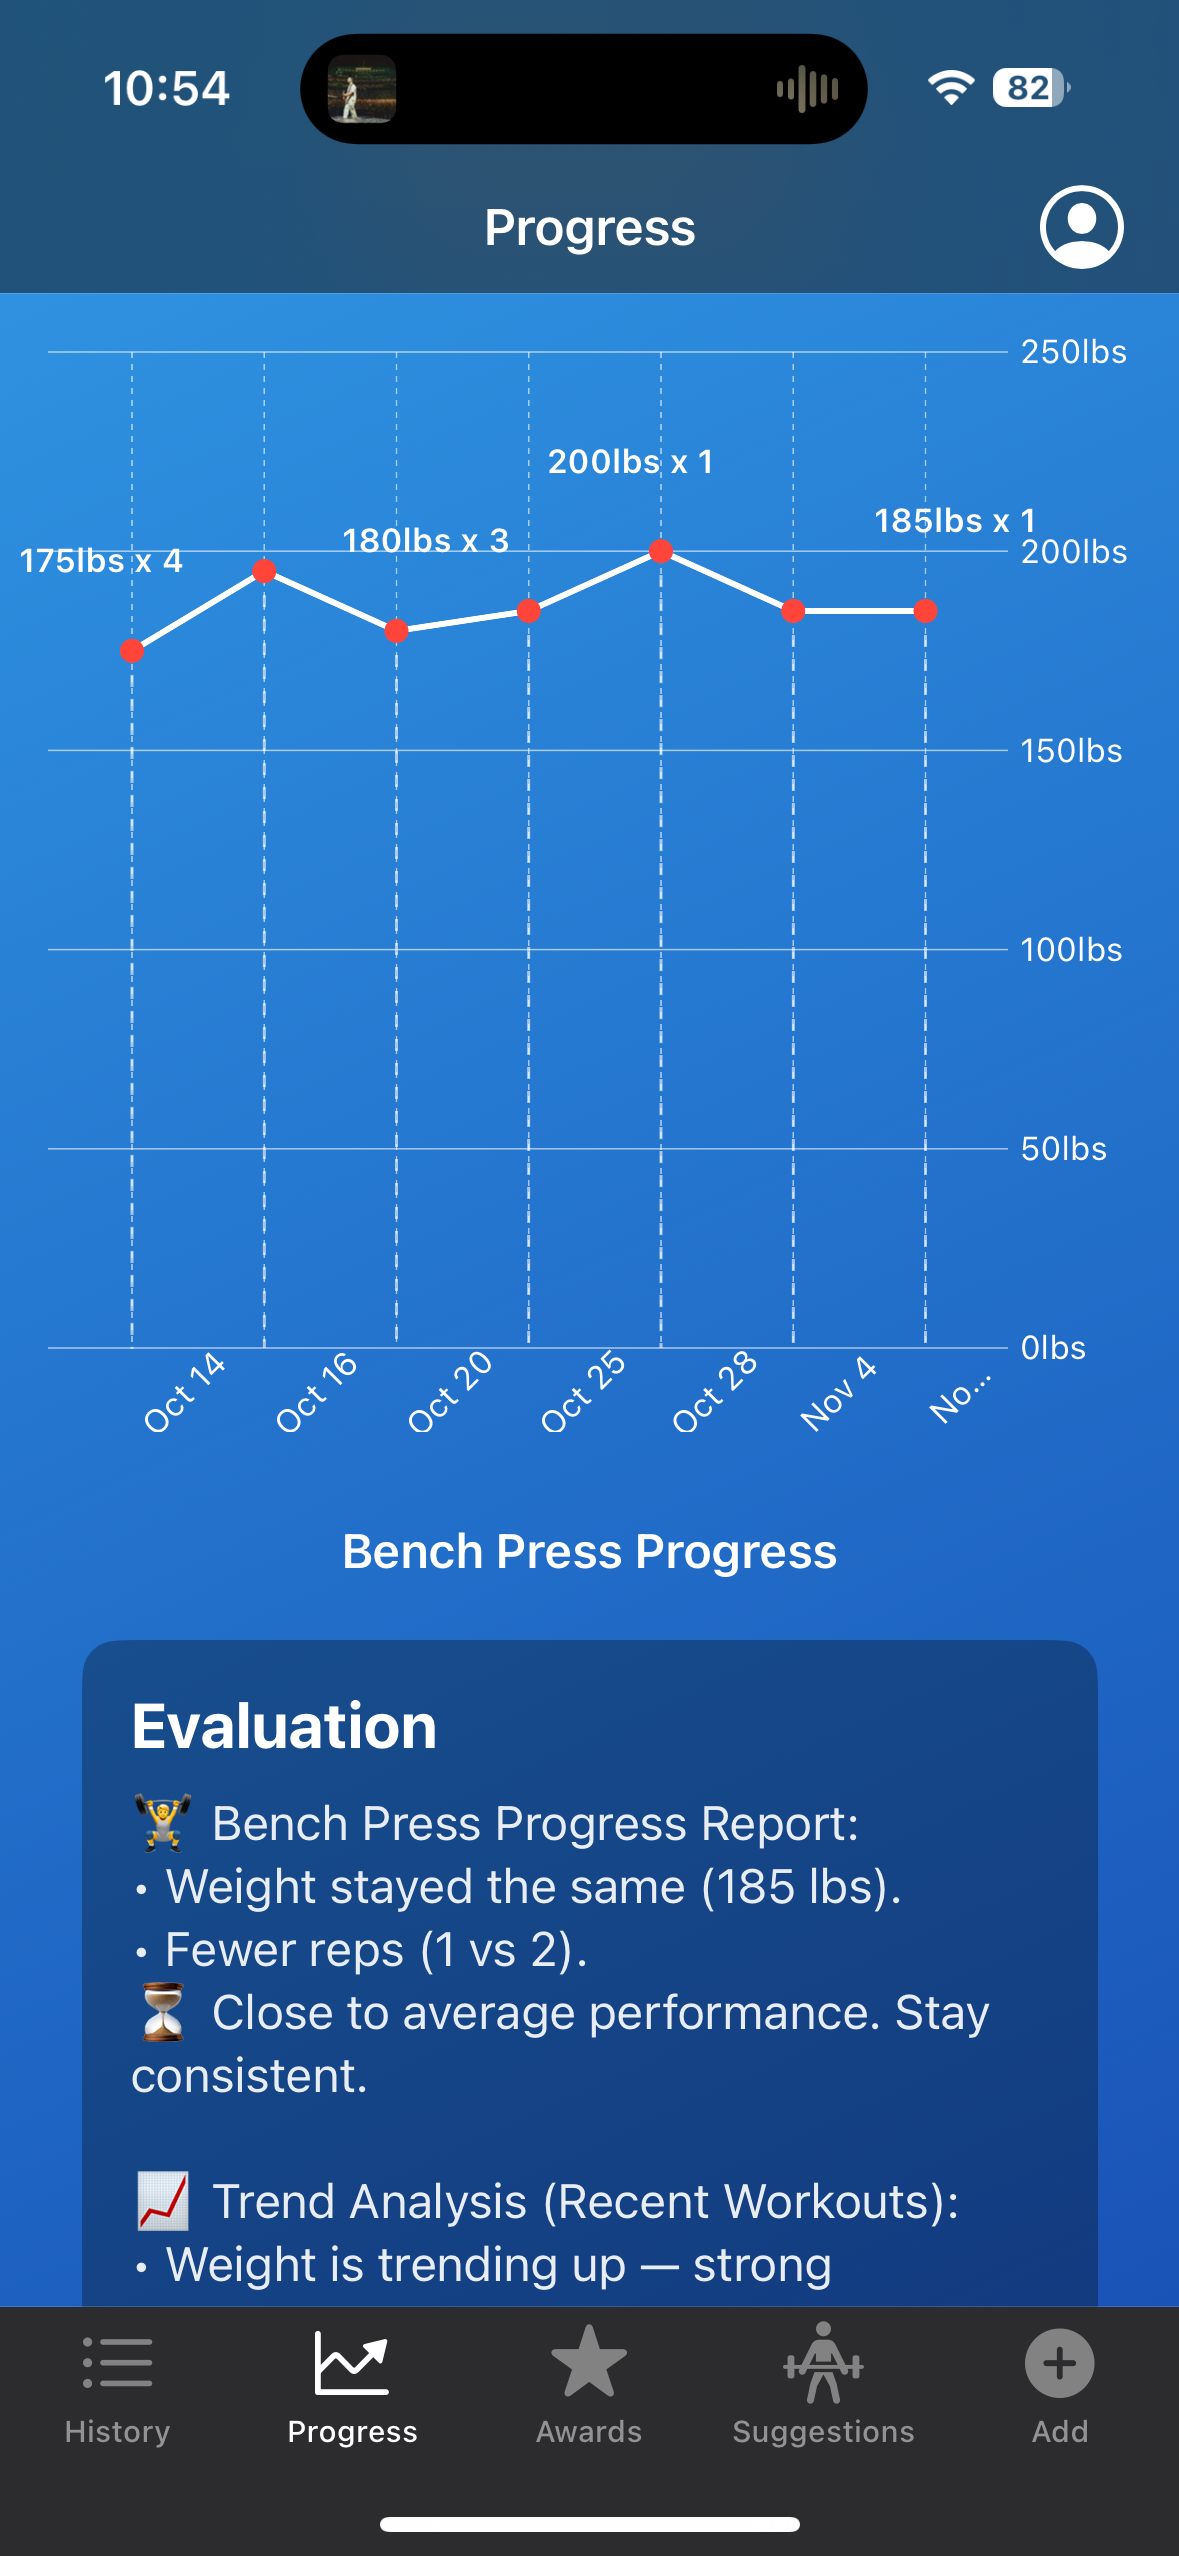
Once new data is added to the History page, it is automatically reflected in the Charts page. The Charts page continuously monitors for newly recorded data points and updates the corresponding exercise-specific graph whenever a new entry is detected. Each graph visually represents trends over time, allowing users to clearly observe their progression in the gym. These visualizations not only make performance trends easier to interpret but also help users review their previous workouts to determine appropriate starting points for future sessions.
After that, the evaluation page also updates. This will give the user simple and concise feedback to aid them. This will provide them with timely insights into whether they are progressing or regressing, it will provide them with feedback on their training routine, recommending whether they should train a certain muscle group more or less. The importance of short and concise feedback is emphasized as I do not want to overload the user with information.
This then brings us to the awards page. This page is meant to bring gamification to life on my mobile app. The goal of this page is to give the user a reason to keep being consistent and coming back to using this app. A majority of the fitness apps contain some type of gamification as it is a way for users to stay engaged. An example of an award would look like entering a workout for 100 days; an award like this gives users incentive to keep going to the gym and bettering themselves each day.
Finally, this includes the profile page. This is a very simple page including a few key details, including personal records, along with how many workouts the user has inputted. This was a way to let the user know their personal record totals, meaning the total weight of the squat, deadlift, and bench press combined. This is a piece of information that lots of gymgoers like to know as it gives the user another incentive to keep training hard.
These components form the core of my application and reflect months of learning, experimentation, and iteration. I began studying app development—including the Xcode environment and the Swift programming language—in January 2024. Since Swift was a new language for me, I wanted to build a strong foundation in its functions, structures, and syntax before fully committing to development. I approached this by comparing Swift to languages I was already confident in, such as Python, Java, and C. This comparative learning strategy helped me see how the concepts I had mastered in previous coursework translated into Swift, ultimately giving me a more complete and intuitive understanding of iOS development. This learning process also deepened my understanding of development methodology. Most importantly, it taught me the value of continuous testing and troubleshooting—principles that cannot be emphasized enough. Early in development, I also learned the importance of feasibility testing. This involves prototyping and evaluating an idea before fully implementing it. A concept may seem perfectly reasonable when discussed in theory, but its feasibility often becomes much clearer once development begins. Some ideas that sound simple in conversation can become significantly more complex when put into practice. It is crucial to understand what can realistically be built. Once a developer commits to delivering a feature, users expect that promise to be fulfilled. Because of this, knowing the limits, challenges, and feasibility of an idea before promising it is an essential part of responsible development. By integrating feasibility testing early and often, I was able to refine my ideas, avoid unnecessary roadblocks, and move forward with confidence in the parts of the application I chose to implement. This leads to the importance of a thorough experiment.
For my experiment, I plan to utilize AI-generated data. The goal of this experiment is to conduct a thorough experiment that aims to evaluate each part of my application. By doing this, I will gain important knowledge and information that can provide necessary feedback to aid the final developmental sprint.
For this experiment, I will utilize AI-generated data to simulate realistic user interactions and workout patterns within the application. Using AI-generated inputs allows me to test the system under controlled, repeatable conditions without relying on human data at this stage of development. This approach ensures that I can evaluate each feature of the app—including data processing, visualizations, and system responsiveness—using consistent and diverse datasets. AI-generated data also enables me to stress test the application and identify potential issues early. By incorporating this method, I can gather meaningful insights and feedback that will directly inform and improve the final development sprint. While AI-generated data is highly useful for early-stage testing, it is important to acknowledge both its strengths and its limitations. AI data provides clean, structured inputs that allow for controlled experimentation, making it ideal for identifying technical issues, validating core functionality, and ensuring the app behaves as expected across a wide range of scenarios, in this case across different mobile devices. However, AI-generated data cannot perfectly replicate the unpredictability and variability of real human behavior. Because of this, the results of AI-based testing must be viewed as preliminary. Even with these limitations, AI-generated data remains a powerful tool that enables efficient, iterative testing and helps streamline the development process.
This experiment aims to provide me with feedback on graph compression, responsiveness, data processing, and query times. As visuals are a key component of this application, the importance that they are clean and legible cannot be emphasized enough. Some research questions that this aims to answer are as follows:
- How will the graphs look with one year’s worth of user data?
- How will the graphs compress?
- Will the data points be too close together?
These are all essential to the success of my application. Without knowing the answers to all these questions, the app would feel incomplete. Moving forward with this concept involves gaining knowledge of responsiveness. This theme is of number one importance within app development. Developers pride themselves on giving a fun and engaging user experience. If the app takes ten seconds to load a specific page, users will most likely find a different application. Learning about the amount of data it takes to slow down the app or if it even slows down at all is an essential question. Providing this application with years’ worth of data will answer this question. Checking and examining the responsiveness of moving between pages, loading the application, and touch responsiveness will all be of utmost importance to answer. Query times are very similar to this theme. Within the application, there are many different search queries, like personal records, for loops actively looking for a specific experiment, and many more. How will these be affected when they have to look through 1000 or 5000 data points? Being able to provide evidence that this app can run these queries without the time being affected will be a very strong argument and point for my application.
This experiment, in conclusion, is well developed and aims to conduct a study in place for a human study. This AI-generated data allows me to experiment in a controlled environment where the defined variables are a strong point of this experiment.
Related work
Review of Existing Aplications
Whoop
Whoop is the only wearable device with a mobile application that I think is worth considering and looking into. For a brief introduction, Whoop is a wearable device that consists of a mobile application and a website. As of the current Whoop 5.0, there are three different tiered subscriptions. All of these subscriptions come with the device as long as you are actively paying for the subscription.
Whoop One is the first and most affordable subscription option. This plan includes:
- Whoop 4.0 wearable, the previous-generation device with a 5-day battery life
- Sleep, strain, and recovery insights
- Personalized coaching
- VO2 max and heart-rate zones
- Women’s hormonal insights
This tier costs $199 per year and provides the core functionality of Whoop while remaining the lowest-cost option.
Whoop Peak is the mid-tier subscription and includes everything in Whoop One, plus:
- Whoop 5.0 wearable, the newest version with a 14+ day battery life
- Healthspan and pace-of-aging metrics
- Health Monitor with alerts
- Real-time stress monitoring
This subscription costs $239 per year and is the first tier that includes the new Whoop 5.0 device.
Whoop Life is the highest-tier subscription. It includes everything in Whoop Peak, along with:
- Whoop MG device with 14+ day battery life
- Daily blood pressure insights (beta)
- Heart Screener with ECG readings
- On-demand AFib detection
This is Whoop’s most advanced subscription, priced at $359 per year, and introduces medical-grade features such as ECG and AFib detection.
I used Whoop for about three years when its most recent release was Whoop 4.0. This wearable and application does a great job at providing the user insights about how hard they trained and whether it would be beneficial to take a rest day or have a lighter workout the next day. The important thing to note within Whoop is that it is not directly similar to the app I am creating. Whoop is not geared specifically towards weightlifting but more towards athletic activity. This app does not provide the ability to track workouts or progress within the gym. My main focus with this app is to investigate the importance of well-deployed visuals and graphs, as well as the importance of an intriguing UI. User experience within a fitness app is important as it contributes to user engagement and consistent use of the app.
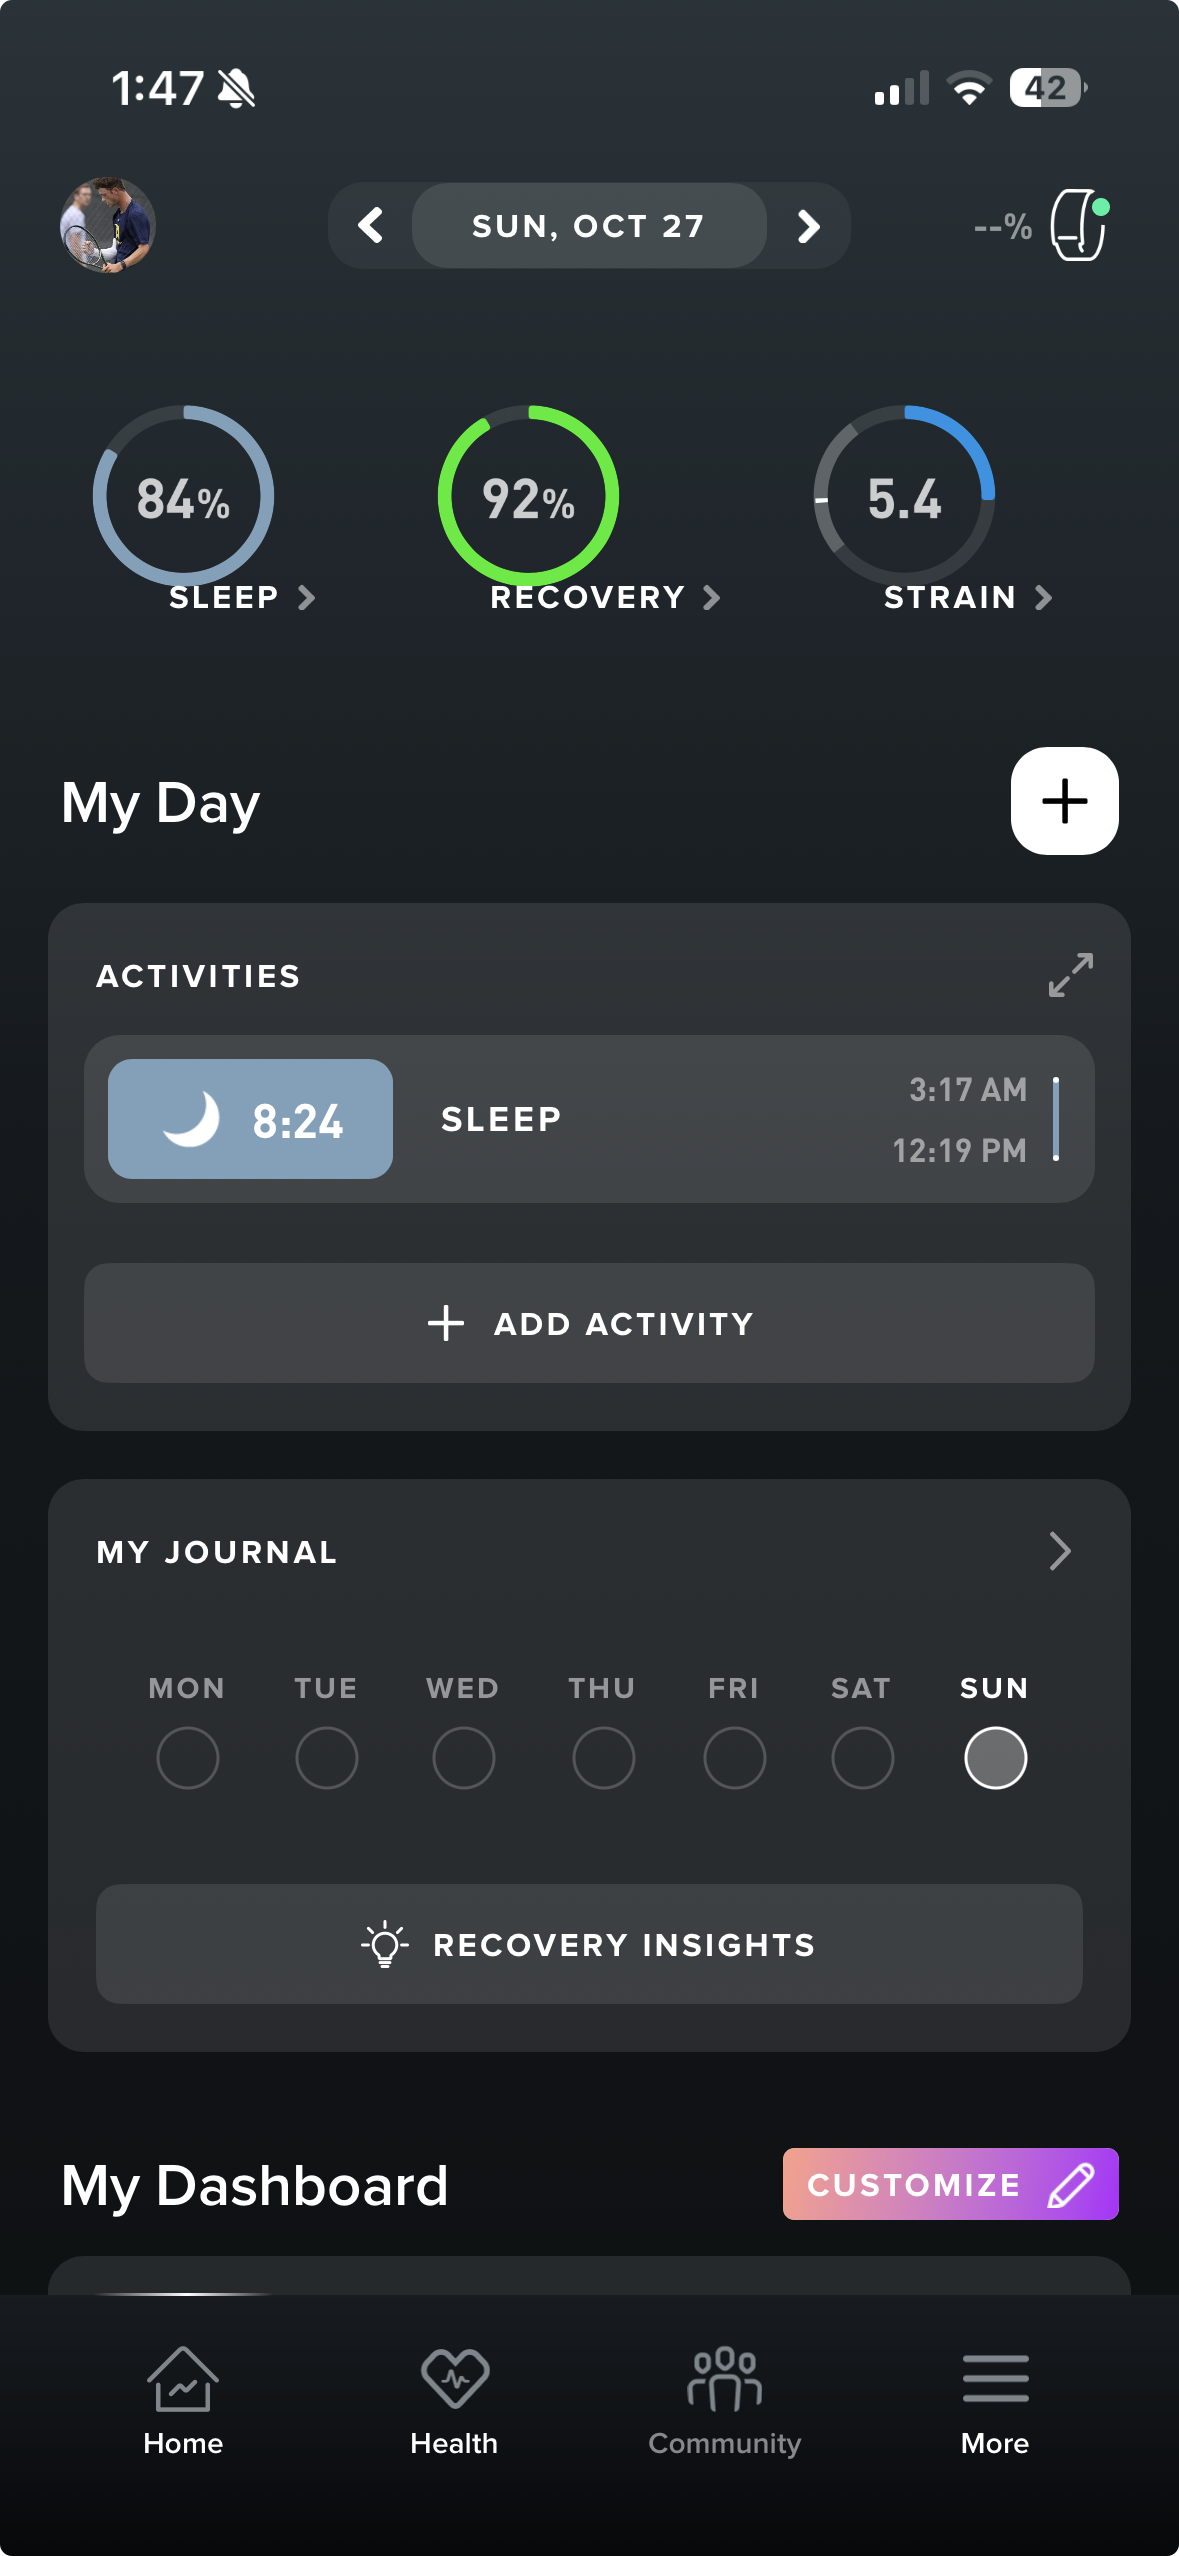
As you can see in this image, Whoop demonstrates a highly organized and well-structured UI and specifically in this image, a landing page. Doing research in this application, I found that the uniqueness of their visuals is something that users enjoyed while utilizing this app ([3]). Attempting to create visuals that can provide the user with an easily readable way to analyze progress is something that I can draw from Whoop, as they very cleanly provide the users with visuals. This aligns with the importance of my app in creating a clean UI and providing the users with well-designed visuals.
Strong
Strong is a mobile workout tracking application that allows users to manually input exercises, sets, reps, and weights to monitor progress over time. The app provides data visualization tools such as charts and personal records to help users evaluate their strength progression. Like the my project, Strong emphasizes user input rather than wearable data, focusing on the user’s engagement in tracking and reflecting on their workouts.
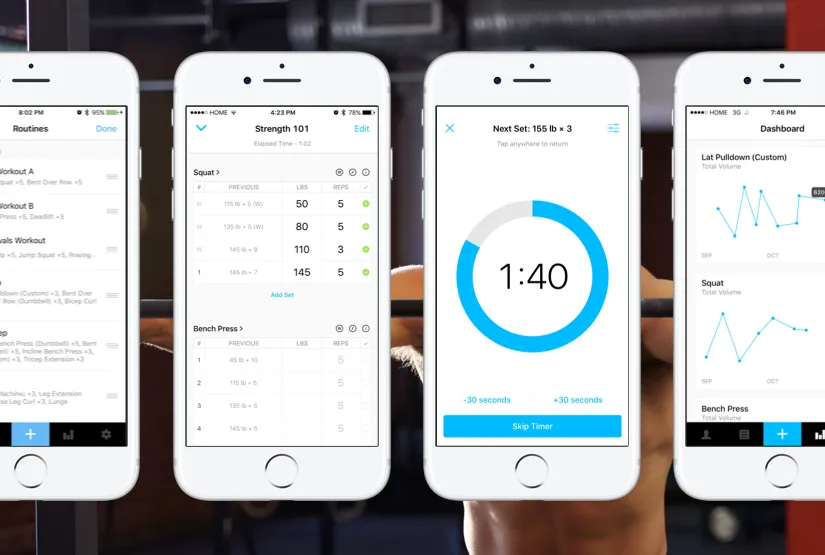
Strong has many strengths within their app. Their main focus comes within an engaging workout log feature. You can see within this image that it is very unique in the elements that the log contains. It allows the user to enter in all their common data like weight, sets and repetitions, but it also allows the user to mark the set as a warm up or a working set. The next feature that is unique is that it allows the user to write certain notes to themselves to remember for next time like go up in weight or keep back straight. This workout log creates a unique way to engage the users much more than your common fitness app would. On the contrary, the time it takes to enter in all the neccesary information into this app would be much longer than other apps. I believe that there is an importance of keeping the workout log to quick and short entries that contain only the neccesary data. By doing this it allows the user to enter all the needed data in under ten to fifteen seconds. Users will not want to be typing away for minutes after their set as it will take away from their workout.
However, its primary limitation lies in its relatively static analytics—while it effectively logs performance, it offers minimal personalized insights or evaluative feedback beyond numerical summaries. Users can see what they lifted and track personal records, but the app does not interpret this data to provide actionable guidance or recommendations tailored to individual progress. There is little indication of trends over time, patterns in strength gains or plateaus, or suggestions for optimizing future workouts. This aspect is common in most if not all of the fitness apps out there currently, being able to provide the user with feedback to aid future workouts is untapped.
My app builds on this foundation by introducing a more dynamic evaluation model. Instead of only displaying raw numbers, it analyzes patterns in user-entered data, identifies strengths and weaknesses, and generates personalized feedback to guide future training. By combining detailed logging with intelligent, interpretable analytics, the app transforms static workout data into actionable insights, empowering users to make more informed decisions and progress more efficiently toward their strength goals.
Fitbod
Fitbod is a mobile fitness application that focuses more on workout planning and recommendations. This app contains similar concepts to workout logging and workout tracking, but focuses on the workout planning aspect as its main selling point. This application still provides the user with the important visuals, so the users can still see their progress or regression. It also contains a workout logging feature, which, in my opinion, is less emphasized compared to the strong app. The main focus within Fitbod is their ability to aid the users in their workout planning, which is able to answer these user questions: What should I work out today? How long should I wait before working out my legs again? Has my muscle recovered long enough to work out that muscle group again?
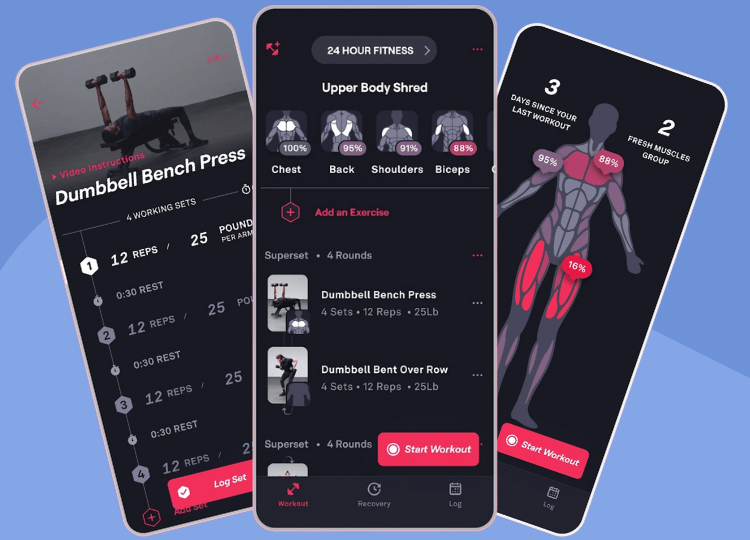
Fitbods’ major strength and focus is their ability to aid users in workout planning. One of the major concepts that this page includes is monitored recovery. After the user logs a workout, Fitbod records the exercises and assigns a percentage of recovery (0-100%) to each muscle group based on the intensity of the workout. Meaning that if the user records a workout that contains 3 chest exercises, the recovery score for the user’s chest will be closer to 0% while the recovery score for legs will be closer to 100% as there was no recorded exercise that focused on legs. This is then portrayed within a heat map for the user’s visual aid, which displays which muscles are fresh and which are fatigued. This is a great concept to help the user understand which muscle group to focus on within their next workout. This system also contains AI-powered suggestions. From researching this further, the recovery score is a key component of Fitbod’s algorithm, which will use this information to suggest a certain workout for the user. For example, if a muscle group is very fatigued, it will recommend a different muscle group to train next. You are able as the user to change these recovery scores if you feel like the system didn’t correctly portray your recovery status.
Each Fitness application has a strong suit and a selling point; whether it be a workout log, recommendations, or visuals, there has to be something that your app does better than everyone else to stand out. In this case, Fitbod hands down completes workout planning and recommendations better than any other app in the industry.
As every app has its strengths, there are always limitations to any application. In this case, since fitbod is providing the user with similar information that you could receive from a personal trainer, arguably better and more accessible than a personal trainer, it comes at a cost. Fitbod requires a subscription that is either 15.99$ per month or 95.99$ per year. The yearly plan is much more cost-efficient compared to the monthly plan. On the contrary, if you were to compare this price to the price of a personal trainer, the value is much better. As talked about by author Aneta Niepytalska, the cost of a personal trainer can range from 60-100$, depending on where you live ([6]). For many, this can be a steep price to pay for feedback, which makes the Fitbod cost look great.
My app will build on the importance of user accessibility. Being able to provide the user with feedback and suggestions like Fitbod, but also feedback on their workouts, as well as trend analysis, is something that hasn’t been completed yet. By completing this aspect and delivering an evaluation page that provides the user with similar feedback that is simple and concise, it can provide the user with the necessary information while not overloading the user with information. By completing the evaluation while giving it to the users without needing a paid subscription is something that is unheard but something that I believe every gym-goer deserves better yet needs.
JEFIT
JEFIT is a long-standing workout tracking application designed to help users plan, record, and review their training sessions. The app allows users to manually log exercises, sets, reps, and weights, and it includes one of the largest prebuilt exercise libraries available in a consumer fitness app. Like Strong and like the proposed project, JEFIT relies heavily on user-entered data rather than biometric inputs from wearables, emphasizing detailed workout documentation and long-term progress tracking.
JEFIT’s primary strength is its structured workout planning environment. Users can build routines from a large catalog of exercises, organize them into weekly training cycles, and follow them step-by-step during a workout session. The interface highlights rest timers, previous performance, and target rep ranges, helping users stay consistent and organized in the gym. The app also supports extensive note-taking and includes options for tracking time under tension, tempo, and training logs that can be revisited to evaluate how a session felt or performed. This provides a highly organized workout experience that appeals to users who prefer detailed, template-driven training plans. This training plan builds upon the workout planning from Fitbod. The workout planning style for JEFIT is different as it allows users to pick exercises to build and create their own workouts.
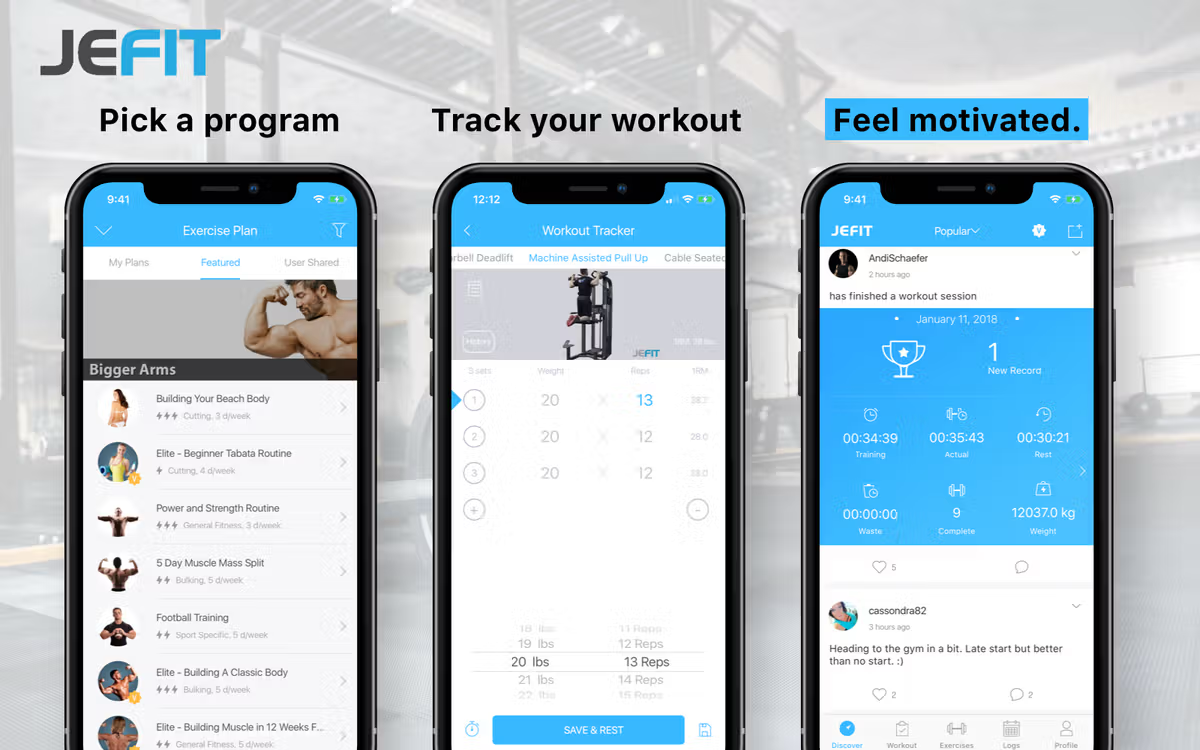
Within this image it displays the ability to pick from a large group of different programs to aid the user in getting started. These different workouts have different target audiences. For example, one audience could be user’s training to become a professional bodybuilder, or the user may be a 50 year old dad that wants to stay active and go to the gym consistently. You can also see in this image like every other app it has a way for users to track their workouts and progress through user-inputted data. As well as containing a way for others to see your data and personal records if they are your friends in app.
The limitations in this app for me come from the amount of time it takes to input data. The app makes it as easy as they can wih the format provided but inputting every set you’ve completed along with weight and repetitions can take time away from a workout. I think it is important to note that within my application, the user is advised to enter their first and only set of each exercise. Studies have shown that your first working set of an exercise is often the strongest set as long as you have properly warmed up the muscle you are utilizing. This is because you are performing with the least amount of muscle fatigue, allowing for the largest force production. As you perform following sets, the muscle fatigue accumulates leading to a performace decline whether it be weight or repetitions. This has driven the component of only requiring the first set from a user. As the subsequent sets are of utmost importance to muscle breakdown and hypertrophy, the first set is usually when people will have personal records whether in weight or repetitions, which is the resoning behind reccomending the user to input their first set of an exercise.
JEFIT like most of the other fitness applications currently available, requires a subscription for their “premium services”. The monthly subscription is 12.99$ while their yearly subscription is 69.99$, again making the yearly subscription much more cost effective. However within this app, the free version does not give you access to any of their real selling points so unless you pay for the subscription the app may not contribute to a person’s progress.
Paying for the premium subscription gives you access to the following:
- Removes all ads
- Access to advanced training reports, charts and analytics
- Includes professional audio cues and exercise tips
- Unlimited smartwatch workouts
- Premium workout plans
- Ability to compare workouts with friends
However, despite its strong organizational tools, JEFIT’s analytics remain largely static. While it displays charts, personal records, and historical averages, the app rarely interprets those trends or provides meaningful feedback beyond raw statistics. Users can view numbers, but the app does not generate insights about performance patterns, identify plateaus, or suggest adjustments based on user behavior. As my project aims to complete this problem, this is similar throughout al of the fitness apps I am diving into. Paying for this subscription gives the user access to many important tools that can help the user but I finid it hard to believe there is a better tool than feedback and reccomendations to the user.
Hevy
Hevy is a modern workout tracking application designed to provide a clean, streamlined experience for logging strength training sessions. Hevy centers on manual user input—exercises, sets, reps, and weights—rather than wearable integration. The app is known for its minimalist interface, fast logging workflow, and community-oriented features that let users share workouts and progress with friends or followers. This is a very important app to compare and talk about in comparison to my app. This apps selling point is the simplicity and how straight to the point the app is. This app doesn’t pride itself in innovations and uniqueness but rather in simplicity and a well designed UI.
This app contains of three major concepts, workout logging, measure progress and community motivation. These are the three conponents of this app that they have decided to develop and make stand out. The workout log is similar to other apps in the aspect of entering exercise, weight and repetitions as well as labeling the set as working or warm-up and having the ability to add notes. Once the user inputs their workout data, it gets uploaded to their personal data charts and visuals. Within this page the user has the ability to visualize their progress and see personal records for the specified exercise. Once again the focus point being simplicity and a well designed UI. Finally they provide the ability to join a community. User’s are able to join communities to follow other athletes that use the app, like and comment on workouts and save other athlete’s workout routines.
This application in my opinion is the most similar to what I am developing. As you can see in the image, this app focuses being simplicity and user experience. The Hevy app does not overload the user with loads of information and visuals but keeps it simple to allow the user to easily visualize progress. The main difference is that Hevy does come with a paid subscription that compared to other apps is much cheaper. This subscription has three options: 2.99$ per month, 23.99$ per year, or 74.99$ for a one-time lifetime fee. This is because it is a much simpler app that thrives at what it aims to complete but lacks of some of the components that Strong or Fitbod contain.
Hevy’s biggest strength lies in its simplicity and usability. The workout log is highly intuitive, allowing users to enter sets quickly, duplicate previous session data, and make adjustments without navigating through cluttered menus. The design emphasizes clarity: past performance is shown directly below each exercise, and graphs for volume or personal records are only one tap away. Hevy also includes helpful features like custom exercises, supersets, rest timers, and the ability to attach notes to individual sets. This creates a fluid logging experience ideal for users who want efficiency without sacrificing detail.
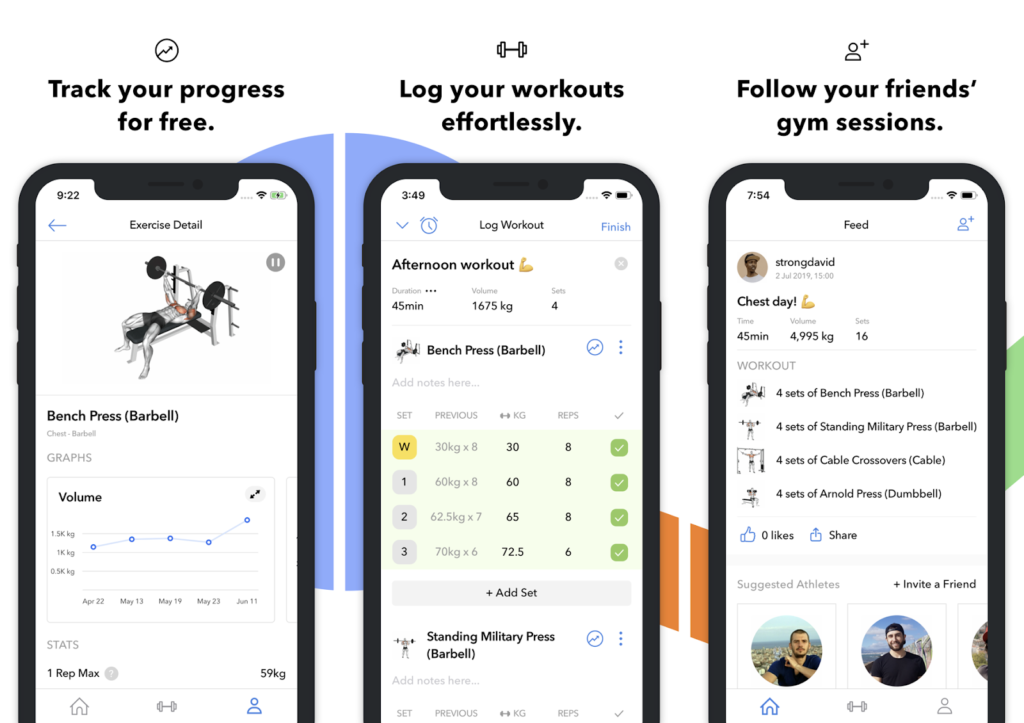
Hevy’s biggest strength lies in its simplicity and usability. As you can see in the image, this app is much more simple within the design which helps users to understand how to use the application much better than a more complicated UI. The workout log is highly intuitive, allowing users to enter sets quickly, duplicate previous session data, and make adjustments without navigating through cluttered menus. The design emphasizes clarity: past performance is shown directly below each exercise, and graphs for volume or personal records are only one tap away. Hevy also includes helpful features like custom exercises, supersets, rest timers, and the ability to attach notes to individual sets. This creates a fluid logging experience ideal for users who want efficiency without sacrificing detail.
However, similar to the other applications, Hevy’s analytics remain largely basic. While the app generates charts, volume graphs, and personal best summaries, it does not interpret these data points or provide personalized training insights. Users can view trends, but the app does not identify plateaus, highlight meaningful performance changes, or offer recommendations based on logging history. The proposed project extends beyond these limitations by introducing an adaptive evaluation system that interprets user-entered workout data, generates individualized feedback, and delivers deeper performance analysis rather than merely presenting raw progression graphs.
Review of Existing Literature
Developing an effective health and fitness application requires more than simply tracking data—it depends on understanding how users stay motivated, how behavior change occurs, and which design choices actually support long-term engagement. Existing research on mobile health apps provides a critical foundation for this work. Studies in this area examine how design features, such as feedback, rewards, and gamification, influence user adherence, highlighting both successes and common shortcomings in current app approaches. Reviewing this body of literature is essential for identifying evidence-based strategies, avoiding ineffective design patterns, and grounding the development of my project in proven behavioral and motivational principles. This context ensures that the app not only functions technically but is also aligned with research-backed methods that promote consistent use and meaningful health outcomes.
Gamification Use and Design in Popular Health and Fitness Mobile Applications (Cotton and Patel, 2018)
Mobile health and fitness applications have rapidly expanded in popularity, offering users convenient ways to monitor workouts, track biometrics, and support healthy behavior change. A key design strategy used in many of these applications is gamification, defined as the integration of game-like elements, such as goals, challenges, rewards, or feedback. This aims to increase user motivation and adherence. Recent research has examined how gamification is implemented across commercial health and fitness apps and whether these design choices align with behavioral-science principles.
One of the most influential analyses in this area is the study by Cotton and Patel ([1]), who evaluated the 50 most popular free health and fitness apps from the Apple App Store. Their findings showed that 64% of apps included at least one gamification feature. The most common elements were goal-setting (78%), social influence (78%), and challenges (63%). In contrast, classic game mechanics such as points (6%) and levels (3%) were rarely used. Cotton and Patel argued that while gamification is widely present, the depth of behavioral-science integration remains limited.
Talking about the results and this experiment specifically, it delves into different mobile applications and what each app contains in terms of gameification. These categories include goals, high scores, streaks, collaborations, challenges, etc. It is important to note that not all of these apps within the study are fitness apps, but they contain many running, cycling, and weight loss apps. So to specify, apps within all realms of fitness lifestyle.
I think that this brief experimental study is a good introduction and overview of what is important to include within a fitness app. Cotton and Patel helped me to understand roughly what percentage of apps include certain aspects of app development that my app includes. Knowing and recognizing that this is a very brief study to categorize what important aspects most fitness apps include was important background information for me to gather.
Variously and freely to use: Exploring routine and innovative use of fitness apps from a self-management perspective
This study ([5]) delves shows the importance of diving into the use of fitness apps. The article investigates how individuals use fitness applications by applying an “exploration–exploitation framework”. Instead of treating the use of fitness apps as a simple active or inactive binary, the study identifies two major usage patterns: routine use and innovative use. Routine use occurs when users habitually rely on the app for consistent tracking, guidance, or daily routines. Innovative use occurs when users explore new features, engage with the app intermittently, or use it during spikes of motivation.
The researchers developed a theoretical model combining goal-setting theory with exploration–exploitation concepts and used user data to evaluate how these behaviors manifest over time. Their findings show that fitness-app engagement fluctuates, and users often shift between stable routines and more experimental patterns. The study highlights that user needs and motivations change dynamically, meaning effective fitness apps must adapt to different usage modes.
This paper by these authors ephasize it is important because it goes beyond basic metrics like downloads or step counts and instead focuses on how people actually use fitness apps over time. Its findings reveal several key insights:
Fitness-app engagement is not linear. Users rarely stick to the same behavior pattern. They often change between routine and exploratory use depending on motivation, goals, or life context.
Retention depends on flexibility. Apps designed for only one type of usage (e.g., daily routine tracking) may fail to satisfy users who prefer occasional or experimental use.
Long-term success of fitness apps is linked to adapting to changing user goals.
Re-engagement features have real value. Innovative users often return during goal shifts or motivational bursts, meaning apps should support smooth “re-entry” without penalizing inactivity.
For researchers and developers, the experiment shows that understanding behavioral patterns gives more meaningful design guidance than simply measuring activity levels. It emphasizes user diversity and highlights the need for adaptive design for any modern fitness or health app.
The findings of this study directly inform the design and goals of my mobile fitness application, which relies on user-entered workout data. The article’s distinction between routine and innovative usage patterns is especially relevant because my app must accommodate users whose engagement levels may vary over time. Some individuals may consistently log every workout as part of an established fitness routine, while others may return only during specific motivation peaks, new training phases, or when attempting to get back into shape. The study shows that these patterns are normal and expected, which supports designing the interface to be flexible, intuitive, and low-friction regardless of how frequently someone interacts with the app.
The article also highlights that users shift between different goals and motivational states, meaning the app must not assume a single, stable form of usage. For my project, this means implementing features that make both consistent logging and occasional re-entry effortless. For example, the app should allow users to quickly enter workout details without navigating through complicated menus, and it should clearly present progress trends even if data entries are not perfectly consistent. This aligns with the study’s insight that fitness apps need to support both “exploitative” routine behaviors and “exploratory” sporadic interactions.
Another important connection is the study’s emphasis on designing for re-engagement. Because innovative users commonly return after gaps in use, my app must handle periods of inactivity without penalizing the user or making the returning process feel overwhelming. Instead of assuming continuous adherence, the app should encourage users to pick up where they left off by summarizing recent history or highlighting how new entries contribute to long-term patterns. This approach directly reflects the study’s conclusion that fitness apps should adapt to the fluid, shifting nature of user motivation.
Overall, the article strengthens the theoretical justification for the core design principles of my project. By showing that real fitness applic users exhibit evolving use patterns, the study validates my focus on creating a logging system that is simple, adaptable, and welcoming to both daily and occasional users. Its findings emphasize that user-entered data apps must be designed around flexibility and engagement over time, which directly shapes how my project approaches user flow, data entry, and presentation of long-term progress.
A Systematic Review on Visualizations for Self-Generated Health Data for Daily Activities
Kim ([4]) presents a systematic review of studies that evaluate visualizations for self-generated health data collected during daily activities. The review breaks down what kinds of visualizations researchers used (like timelines, dashboards, and comparison charts), what types of data they focused on (such as steps, sleep, or exercise), how these visualizations were tested (usability tests, walkthroughs, or real-world trials), and what outcomes they aimed to support, like helping users gain insight, change behavior, or make health decisions. From these studies Kim derives an evaluation framework that categorizes visualization utility across levels of actionability — from simple awareness/monitoring up to supporting concrete actions or clinical decisions. The review also identifies recurring design challenges (cognitive overload, ambiguous units, inconsistent timescales) and recommends evaluation best practices. I really like this paper as it provides insights to how visualizations influence users’ understanding, motivation, and behavior when interacting with this data.
In this article it really provides 2 different approaches for visualization. These 2 main categories are as follows:
Data Visualizations
- Bar charts, line graphs, stacked bar charts
- Strong for trends, comparisons, and giving accurate numerical cues
- Most common in fitness apps because they’re simple and mobile-friendly
Infographics
Icons, metaphors
Useful for low-literacy users, quick meaning, emotional engagement
Can boost motivation or interest
Within the fitness application industry, almost every app will utilize both of these approaches. To aid the user in their journey, you need to provide the user with charts and graphs. Line graphs being the simplist way to visualize data, to be able to see progress. We see many different types of graphs but all are used for the ssme goal, visualizing data. On the other side, a bar graph is utilized within the fitness industry for comparisons. For example, workouts per week or even steps per day.
The next thing that this paper talks about that is important to recognize is how these visualizations influence the user behavior. This study identifies six levels of efficacy, that are split into cognitive (mental understanding) and physical (behavior action). These map directly
Cognitive Effects (Mindset)
- Attract Interest: Visuals that are fun, colorful, or metaphorical make users open the app more
- Enhance Self-Awareness: Clear graphs help users to understand their health status
- Enhance Motivation & Self-Efficacy: Progress bars, streaks, or green/red colors influence confidence and motivation
- Gain Insight: Trend analysis helps users connect behaviors (bad sleep = low steps next day)
** Physical Effects **
Promote Behavioral Change: Seeing gaps or progress increases motivation
Promote Self-Care / Community Health: Tailored visualizations encourage sustained healthy habits
Through all of these effects because of the visualizations, the main goal is to improve the users’ understanding of health data, which increases the engagement and leads to significant behavior change. Learning and understanding about all of this is important as visualizations are a key selling point for a fitness application.
Thematic Connections
Across the selected research and the fitness applications examined (Hevy, Fitbod, WHOOP, Strong, and JEFIT), several shared themes emerge that highlight how modern health technologies attempt to motivate users, support long-term engagement, and provide meaningful feedback. These themes directly correlate to my project.
Engagement and Motivation Through Design
The gamification paper emphasizes how features like challenges, streaks, achievements, and progress indicators can boost short-term motivation but must be thoughtfully designed to sustain long-term use. This theme appears clearly in real apps:
Fitbod uses adaptive workout recommendations that give users a sense of progress through muscle fatigue tracking and streaks.
Hevy incorporates badges, workout milestones, and leaderboards that align with the paper’s findings on motivational triggers.
JEFIT includes goals, calendars, and training plans that resemble early forms of gamification.
The literature and the apps both show that engagement is not just about collecting data—it’s about creating an experience where users feel rewarded and see evidence of improvement. By providing the users with a unique experience within the application, this creates the oppurtunity for long term engagement. I want users to use this app to help them through every workout in the gym. The goal isn’t to create an app that has users utilize the app for 1 month stints, but rather to use it for years of training. By learning and researching about user engagement through design, it helps me to understand what within an application can create long term engagement.
The Role of Ease-of-Use and Habit Formation
Research on fitness app usage highlights that users often stop using apps when tracking becomes inconvenient, repetitive, or overly manual. Through the research in the article that talks about routine and innovative use of fitness apps ([Li-Sun-Wang-Guo2024?]), it is evident that it is easier for someone who has the routine of workout tracking to use these fitness apps. Creating a way for the users to easily find this routine of workout logging and tracking is of utmost importance. This helped me to develop and understand the importance of creating my app in a simple and easy-to-use way. Meaning that if my app becomes too complicated to enter data or visualize data, it is harder for the users to find that routine. My app has a simple way to input data that only takes about 15 seconds, making it much easier for users to implement this in their daily gym routine.
We see this exemplified within some of the apps that I previously talked about.
Strong focuses on fast, minimal-effort logging, by tapping the exercise and enter sets. This displays the research that simple interfaces support habit formation.
Hevy uses templates and quick-add features to speed up workflow.
Fitbod automates workout planning entirely, reducing the user’s cognitive load.
The apps demonstrate the same principles found in the literature: users stick with systems that minimize effort and streamline self-tracking.
Visualization as the Bridge Between Data and Action
The visualization review shows that how data is presented determines whether users can interpret trends, identify patterns, or make behavior changes. The research stresses multi-time-scale charts, clear labeling, and actionable insights. When researching different fitness applications, a majority of the time, the thing that helps an app stand out is how the data is visualized. To create a successful fitness app, there has to be a well-constructed visualization of the user’s data. This visualization needs to provide the user with the ability to easily analyze the data to see progression or regression. If the user can’t tell if what they are doing is progressing, then the visual has failed to complete the task it aims to solve.
These apps provide strong examples of these visuals:
WHOOP excels at data visualization, giving users daily, weekly, and monthly reports on strain, recovery, and sleep.
Fitbod visualizes muscle fatigue and session volume through color coding and bar charts.
Strong and Hevy provide personal record charts, volume graphs, and exercise history timelines.
These apps show how effective visualizations transform the user’s data into insights that align with the paper’s claim that clarity and context drive understanding and action. This relates to the work within my application that I am creating. A unique visual that stands out within the fitness application industry, which solves the issue of simplicity.
A Systematic Review of Synthetic Data Generation Techniques Using Generative AI
As my mobile application has a focus on data analysis for my experiment, it is of utmost importance that I look into different papers that talk about the standard process of data analysis and regarding the use of synthetically generated data. Understanding how to generate this data correctly, will validate my experiment and help it become more credible and professional.
As an introduction to this article, this paper provides a comprehensive systematic review of research on how synthetic data is generated using generative AI techniques such as GANs (Generative Adversarial Networks), VAEs (Variational Autoencoders), and LLMs (Large Language Models). This synthetic data is defined as data that retains the structure and patterns of real data without exposing sensitive or identifying details, making it useful in analytics, model training, and test environments. This study seemingly defines the foundational benchmark for understanding the state of synthetic data methods, which directly ties to my experiment.
The motivation for synthetic data is something thats worth noting in both the professional field, and for my senior comprehensive project. Motivation for synthetic data generation in general stems from the growing demand for large, high-quality datasets and the limitations imposed by data privacy amd cost. This paper emphasizes that real-world datasets are often very difficult to obtain or share, particularly regarding the domains such as health care and finance. Generative AI offers a solution by enabling researchers and developers to generate artificial datasets that resemble real data without directly exposing personal or confidential information. This context is especially relevant for experimental systems that rely on simulated or synthetic inputs to test performance and analyze robustness.
This source provides a baseline knowledge of how to correctly generate the synthetic data that I will be using for my experiment. It is important to make sure this part is done correctly and professionally so that the experiment doesn’t have any holes in it. Fully grasping this concept will also help me to be able to fully document the process that I took to create my experiment.
AutoEval Done Right: Using Synthetic Data for Model Evaluation
This next source directly correlates to my experiment, specifically the evaluation portion. As my experiment is working with synthetic data, it is important that I understand how to evaluate the data and results, since it isn’t human data. This article specifically addresses the challenge of how to reliably evaluate models when using synthetic data instead of real human data. The author shows that naïvely generated synthetic data could possibly introduce bias and misleading results.
To solve this, the paper proposes a statistically principled evaluation framework that separates data generation from evaluation and introduces methods to reduce bias and variance in synthetic benchmarks. The study demonstrates that, when designed correctly, synthetic data can be used as a valid substitute for real evaluation datasets, producing results that closely align with real-world model performance. The authors validate their approach through controlled experiments comparing synthetic and real evaluation outcomes.
My project involves feeding this synthetic data into a mobile application and analyzing the results, specifically load time, graph behavior, graph compression, and more. This paper provides recent evidence that synthetic data can be used to evaluate these types of systems, as long as the evaluation is done carefully. Knowing this, this goes to strengthen my methodology and approach to gathering data about my application. This also protects my experiment from criticism around the use of synthetic data instead of human data.
Moving forward with supporting my evaluation design, AutoEval emphasizes three main things:
- Comparing outcomes from synthetic vs. real-data pipelines
- Measuring consistency of results, not just raw accuracy
- Using task-based evaluation rather than surface similarity
These three things are important for me to point out because they align very well with my app. Specifically talking about load time consistency, graph behavior, and performance under controlled synthetic inputs. This will help me to conclude that if my app behaves similarly under synthetic data, the synthetic data is valid for testing.
Synthetic Data Generation for Screen Time and App Usage
Recent advances in generative artificial intelligence have expanded the feasibility of using synthetic data in application-level research, particularly in contexts where real user data is limited by privacy, cost, or availability. Synthetic Data Generation for Screen Time and App Usage contributes to this emerging area by investigating how large language models can generate realistic smartphone usage datasets that mimic real screen time and app interaction patterns. Unlike broader surveys of synthetic data generation, this work focuses specifically on mobile usage behavior, positioning it as a practical case study rather than a purely theoretical exploration. This makes the paper especially relevant to mobile application research, where user-generated data is central to both functionality and evaluation.
The study proposes a structured methodology for generating synthetic app usage data using multiple prompt strategies and evaluates the resulting datasets along structural and behavioral dimensions. Structural evaluation examines whether the generated data conforms to expected formats and schemas, while behavioral evaluation assesses realism through metrics such as session duration distributions, daily usage cycles, and app diversity. By separating data generation from evaluation, the paper aligns closely with recent work such as AutoEval Done Right ([7]), which emphasizes bias-aware and task-based evaluation of synthetic data. Together, these studies reinforce the importance of evaluating synthetic data not solely by surface similarity, but by how well it supports meaningful downstream analysis.
This paper is particularly important for this project because it demonstrates a concrete standard for supplying mobile systems with synthetic data in an experimental setting. Whereas systematic reviews of generative AI-based synthetic data provide high-level high-level classification frameworks of methods, Synthetic Data Generation for Screen Time and App Usage offers an applied example of how synthetic data can be constructed, validated, and then used as a substitute for real mobile usage logs. This directly supports the methodological validity of providing a mobile application with AI-generated data to evaluate performance characteristics, such as responsiveness, loading time, and visualization changes or bugs.
In the context of this senior comprehensive project, this source bridges the gap between synthetic data theory and mobile app experimentation. When combined with recent evaluation-focused work on synthetic data validity and standardized approaches to data analysis, it strengthens the overall experimental pipeline that generative AI produces the data, established evaluation frameworks assess its quality, and standardized analytical methods interpret application performance outcomes. By situating the project within this growing body of applied research, the study supports the claim that synthetic data can be responsibly and rigorously used to test mobile and fitness-related applications under controlled and reproducible conditions.
Summary
The insights from three research areas of gamification, fitness app usage, and data visualization, combined with the practical lessons from apps like Hevy, Fitbod, WHOOP, Strong, and JEFIT, highlight the core design principles needed for an effective fitness-tracking system. The literature consistently shows that long-term engagement depends on meaningful motivation, simple tracking and logging, and clear visual feedback. The apps are live demonstrations of how these ideas work in real products. WHOOP and Fitbod emphasize data-driven personalization, Strong and Hevy show the value of simple and fast manual logging, and all incorporate elements of progress feedback that align with gamification research. The visualization paper further reinforces that users must be able to clearly interpret the relationship between their actions, manually entered data, and trends if they are going to make informed decisions or sustain behavior change. Together, these themes directly inform the design goals of my project: creating a fitness application that interprets user-entered data, supports effortless user input, and presents information through personalized visualizations. In summary, both research and existing apps point toward the same conclusion: the creation of a successful fitness application must seamlessly merge motivation, usability, and insight. My project draws from these findings to build a platform that not only tracks data but transforms it into meaningful feedback that encourages long-term consistency and healthier habits.
Method of approach
Overview of WorkoutTracker
WorkoutTracker is a dynamic fitness app designed to help users log, monitor, analyze, and receive evaluations on their workouts in a seamless and visually engaging way. Beyond simply recording exercises, the app provides charts, trend analysis, and personalized evaluations, allowing users to track progress, identify patterns, and receive actionable insights on strength, endurance, and fatigue. Its architecture emphasizes a single source of truth for workout data, ensuring that every logged session automatically updates history views, progress visualizations, and predictive assessments in real time. The intuitive interface and integrated analytics make it a tool not just for tracking workouts, but for optimizing training and staying motivated over the long term.
The purpose of WorkoutTracker is to provide users with free and accessible tools to track and evaluate their workouts, helping them improve over time. While fitness can often feel complicated, this app simplifies progress tracking, emphasizing that real growth comes from commitment, consistency, and determination. Providing the mobile fitness world with this application will finally solve the problem of receiving free and concise feedback and analysis to benefit the user.
WorkoutTracker is designed for fitness enthusiasts of all levels, from beginners who want to establish consistent workout habits to advanced athletes aiming to monitor performance trends and optimize training. Its intuitive interface and automated tracking features make it accessible to anyone, regardless of prior experience with fitness apps. Users can log individual exercises, track weight and repetitions, monitor heart rate, and view historical progress, enabling them to make data-driven decisions about their training routine. Whether the goal is building strength, improving endurance, or maintaining overall fitness, the app supports consistent tracking and evaluation over time.
System Architecture
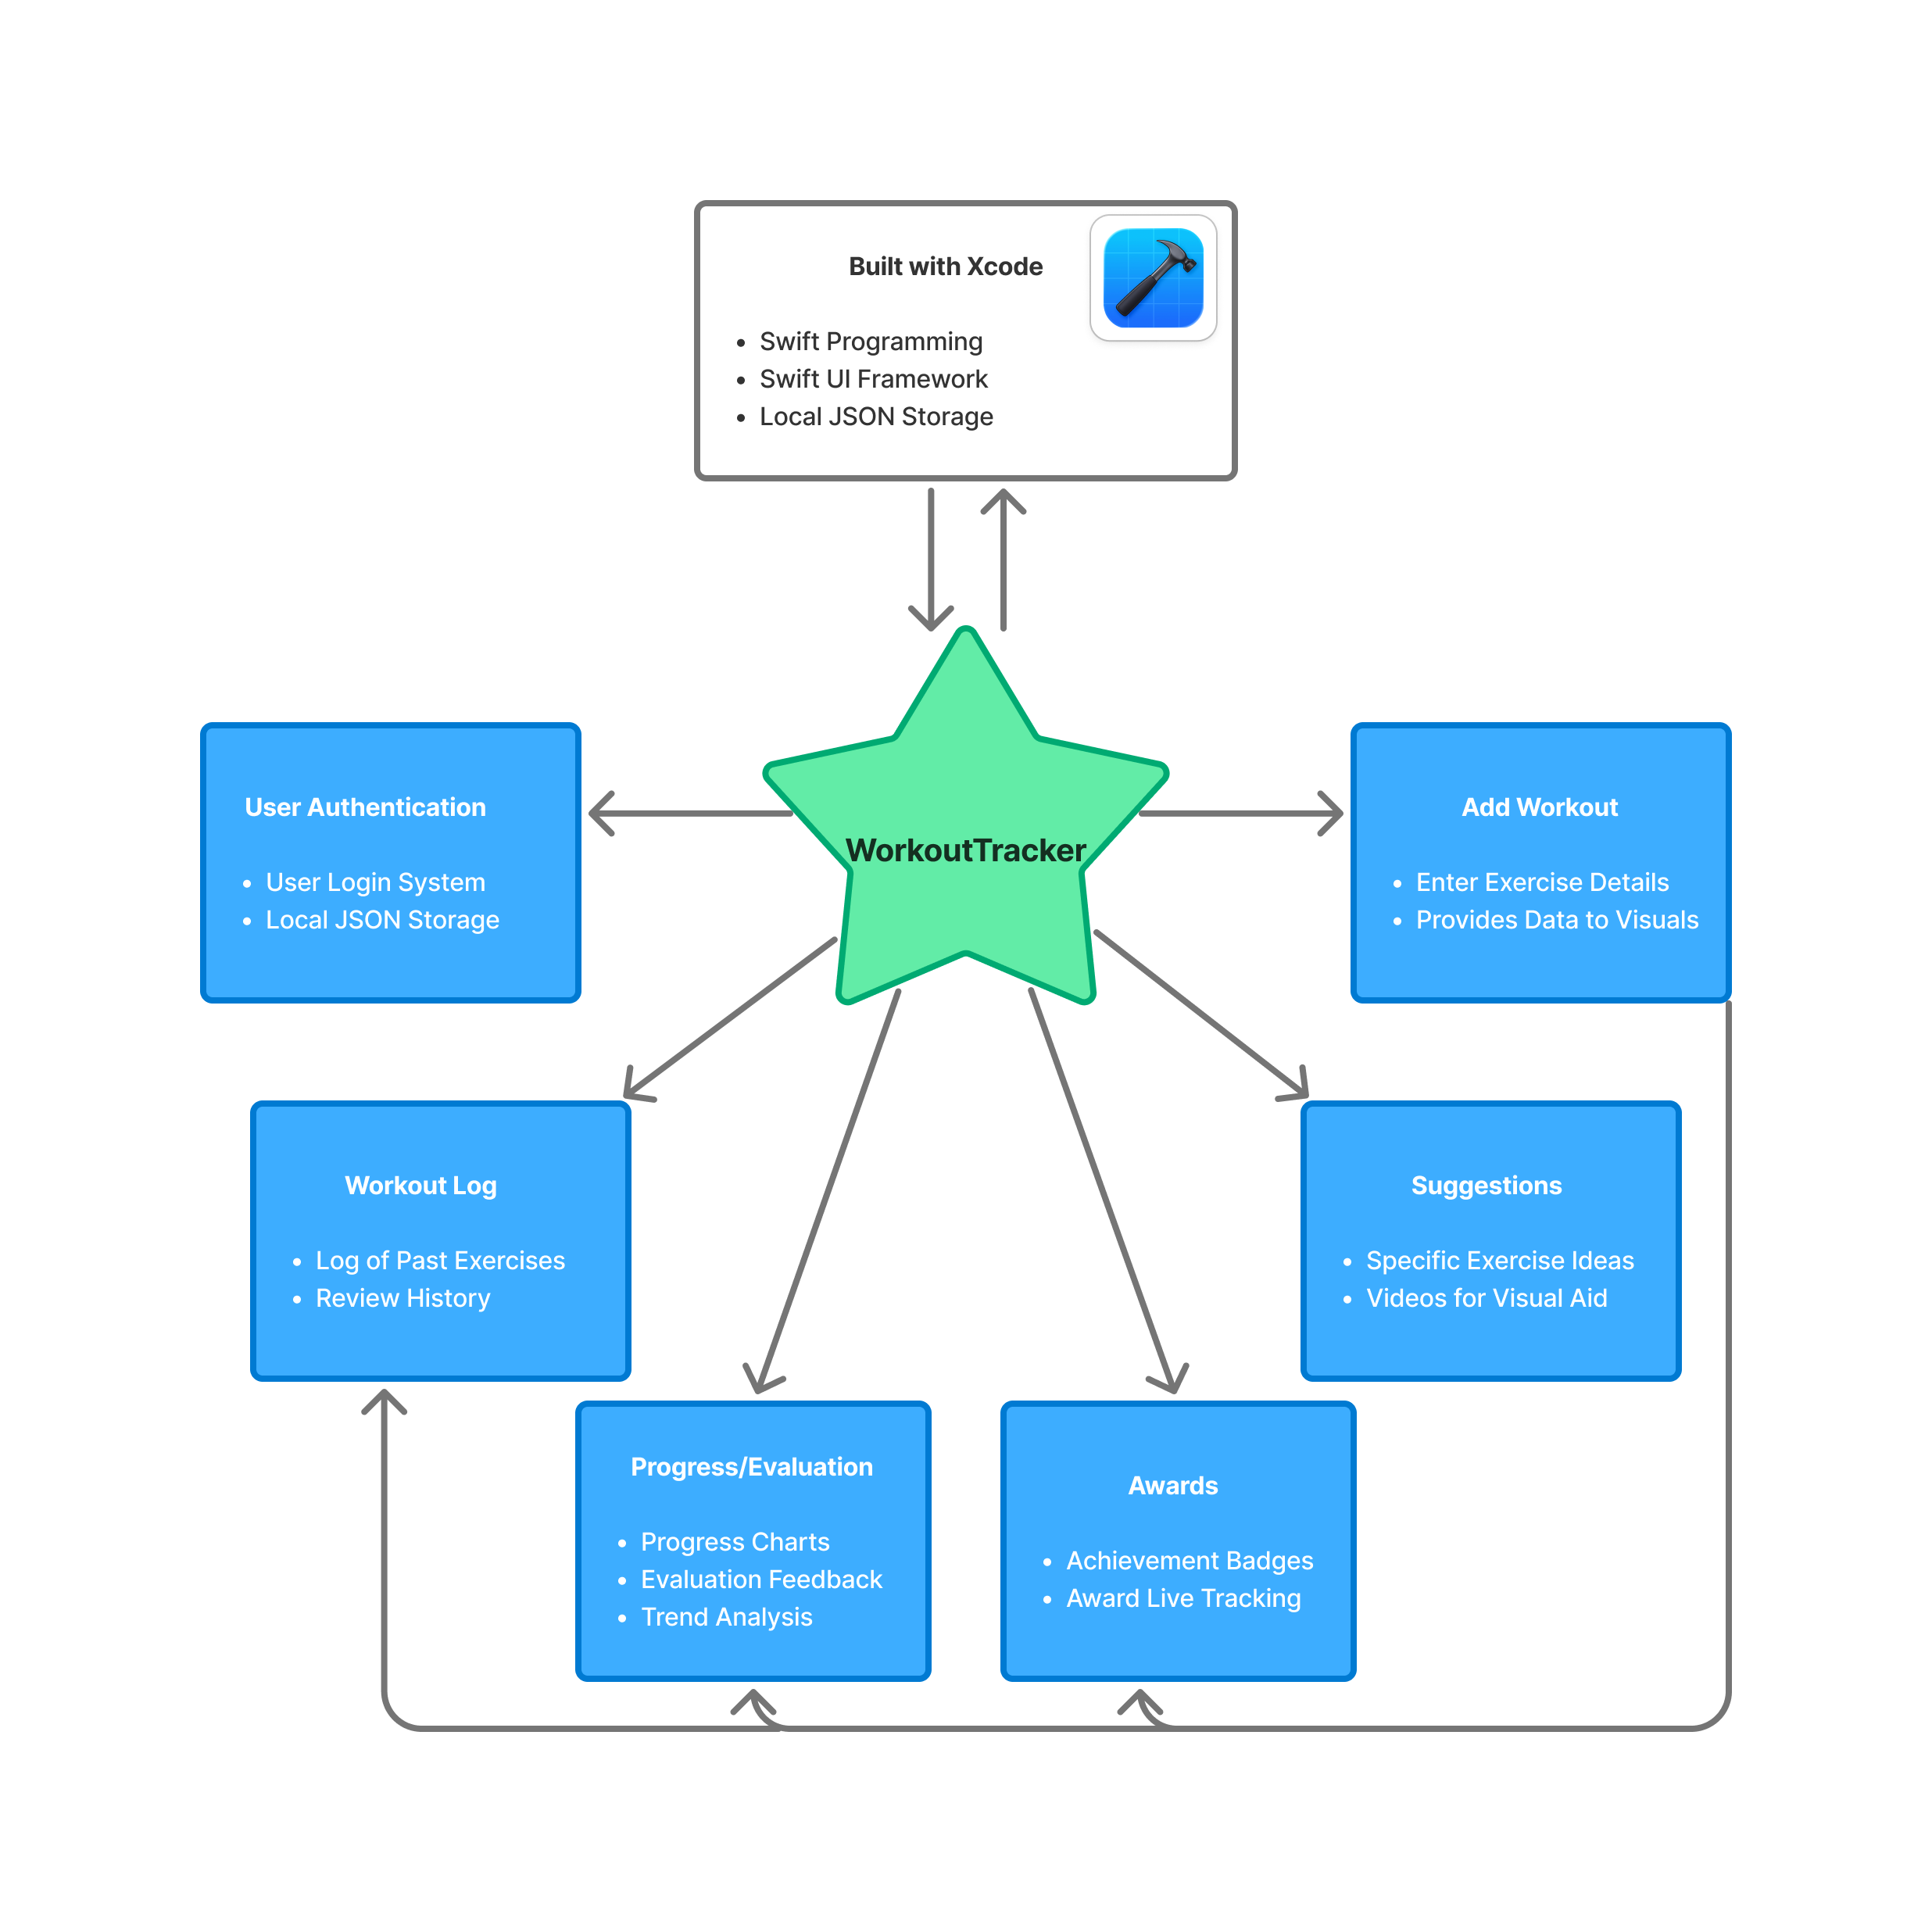
The overall architecture of WorkoutTracker is designed to provide a seamless, reactive experience for users while maintaining a simple design. As seen in the flowchart above, there are many moving pieces within this application that are important to note and explain. Many of these pages communicate together and work together to produce one functioning application. Explaining the Xcode platform and the Swift language will be completed first, after that there are 6 different pages that will be explained: History, Progress, Awards, Suggestions, Add, and Profile.
Xcode
Xcode is Apple’s integrated development environment (IDE) for building applications across its platforms, including iOS, iPadOS, macOS and watchOS. It provides developers with a complete toolkit, including a code editor, interface builder, simulator, debugging tools, and project management, all in one environment. For a mobile app like WorkoutTracker, Xcode allows for rapid development and testing, letting developers design interactive interfaces visually while simultaneously writing and compiling Swift code. It allows users to utilize themselves as a prototype tester for their app by providing the users with 2 choices. Test the app on provided simulators of chosen platform (iOS, watchOS, etc…), or est the app on their own device
While Xcode provides simulators for iOS, watchOS, and other Apple platforms, testing on a live device offers a more accurate understanding of how the app performs in real-world conditions. Simulators are helpful for quickly checking layouts and basic functionality, but they cannot fully replicate device-specific behaviors such as actual touch responsiveness, performance under load, battery usage, or integration with hardware features such as local user creation.
To test WorkoutTracker on a live device, the following steps were taken:
- Device Preparation: The iPhone was connected via USB to the development computer. The device was trusted and registered with Xcode.
- Provisioning and Signing: A free or paid Apple Developer account was used to set up a provisioning profile and code signing for the device.
- Selecting the Device in Xcode: In Xcode, the target device was selected from the run destination menu instead of the simulator.
- Building and Running: The app was built and deployed directly to the device using Xcode’s Run command.
- Live Testing: The app was interacted with on the device to verify UI responsiveness, chart updates, data entry, and performance in real usage scenarios.
By completing these steps, this allowed my mobile phone to have a running version of my current computational artifact during development. Which enabled testing of many aspects of the app that were previously mentioned. There are many additional key features of Xcode that are worth hightlighting.
Xcode is very tightly intergrated with swift, Apple’s primary programming language. It provides realt-time syntax highlighting, error detection, and compile-time checks, allowing developers to identify and correct issues early in the development process. This tight integration improves code reliability and reduces debugging time.
Xcode includes advanced debugging tools such as breakpoints, variable inspection, and console logging. Additionally, Instruments allows developers to profile CPU usage, memory consumption, and energy impact. These tools are especially important for a fitness app like WorkoutTracker, where performance efficiency and battery usage are critical during prolonged use.
Xcode’s Interface Builder and SwiftUI Previews allow developers to visually design user interfaces and immediately see changes reflected in real time. This significantly speeds up UI iteration and ensures layouts adapt properly across different screen sizes and device types.
Xcode has built-in Git support, allowing developers to track changes, manage branches, and revert to previous versions directly within the IDE. This is essential for maintaining code stability as features are added or modified throughout development. Haing built-in GIT support was crucial for this project. It allows continuous work saving within a repository that can be tracked and viewed by my colleagues and professors.
Xcode manages the full application lifecycle—from development and testing to archiving and preparing the app for distribution via TestFlight or the App Store. This makes it a centralized tool not only for development but also for deployment and maintenance.
Xcode provides detailed build logs and warnings that help developers understand compilation errors and runtime issues. This feedback is crucial for debugging logic errors and ensuring the app meets Apple’s platform requirements. Overall, Xcode serves as a comprehensive development environment that supports the entire workflow of the WorkoutTracker app, from initial design and coding to real-device testing, performance optimization, and eventual deployment.
User Authentication
When the user opens the application, they are automatically brought to the login page. When the user downloads and opens the app for the first time, they will need to press a button to be brought to the user creation page. Within the user creation page, they are prompted to create a username , then create a password that is required to be typed in 2 times for confirmation. To keep this application safe and secure, the username and password are both stored locally on the user’s device. By developing the app in this fashion, it creates the best chance to keep secure data, so only the user will be able to access the account.
Once the user creates this account, they will be brought back to the login page and will now log in with the same username and password that they just created. The information they type into the username and password fields is then checked against what is stored locally within the device. If and only if the information provided matches the stored information correctly, the user will then be allowed into the application. If the username or password is incorrect, an error message will be displayed, telling the user that the information does not match what the app has locally.
This user-authentication system allows this application to keep pushing a safe and secure build, while also making sure that the person signing into the application is the right user.
Add Workout
The page where the user enters all of their workout data is the engine of this whole application. Without the user entering any data, nothing will happen within this application. Once the user enters data, such as repetitions, weight, exercise, and muscle group, this powers all the other parts of this application. As discussed in the upcoming section, the data input by the user then goes to multiple different pages to display different data or evaluations.
Within the add workout page, there are four fields that the user is required to enter. These fields are repetitions, weight, exercise, and muscle group. Once the user has entered all of the following information, they are able to press the save button, which kickstarts the data flow within the system. Each of these fields has a unique purpose within the application. Repetitions and weight solve the same problem of workout tracking over time. If the user consistently enters data of the same workout over time, they are easily able to receive feedback, visualize progression or regression, and track personal records. When the user tells the application what exercise they have completed, it will allow the application to recognize where this data should go. If the user enters a bench press session, the backend of the application is able to recognize the name of the exercise and place the data with all of the other bench press entries. By entering the muscle group, the application is able to more accurately calculate the fatigue of a muscle group, and also is able to group together entries of a specific muscle group.
Workout Log
The Workout Log is the centralized history of all workouts the user has recorded. Its primary purpose is to give users a clear, organized view of their past training sessions, allowing them to track consistency, review performance, and monitor progress over time. Each entry represents data the user manually input such as exercise name, weight, reps, and date. This is displayed in a structured list format for easy scanning.
Beyond simply viewing entries, the log also allows users to manage their data. Users can delete individual entries, giving them control to remove mistakes, outdated records, or duplicate workouts. This keeps the dataset accurate and relevant, which is important because other parts of the app — such as progress tracking, award calculations, and performance evaluations — rely on this stored workout data. In this way, the Workout Log acts as both a historical record and the core data source that powers the app’s analytics and achievement systems.
Progress / Evaluation
The progress and evaluation page analyzes the user’s recorded workouts and transforms raw data into meaningful performance insights. Rather than simply listing exercises, this section identifies trends such as personal records, strength improvements, workout frequency, and consistency over time. Its purpose is to help users clearly see whether they are progressing toward their fitness goals and to provide measurable feedback that reinforces motivation. By evaluating stored workout entries, it turns past activity into actionable performance information.
The evaluation portion is the center of attention within this application because it provides a level of personalized performance feedback that is not commonly found in basic workout tracking apps. While many fitness apps allow users to log exercises and view past entries, they often stop at simple data storage. This application goes further by actively interpreting that data to generate meaningful insights, such as tracking personal records, identifying strength trends, and highlighting consistency patterns. Instead of forcing users to manually analyze their own progress, the evaluation system transforms raw workout entries into clear, actionable feedback.
What makes this feature especially valuable is its ability to connect effort with measurable results. By continuously analyzing logged workouts, the evaluation system gives users a deeper understanding of how their training habits impact their performance over time. This creates a more engaging and motivating experience, as users are not just recording workouts—they are receiving structured feedback that reinforces improvement and goal progression. In this way, the evaluation component becomes the defining feature of the application, elevating it beyond a simple workout log and into a performance-driven fitness tool.
Profile
The profile page serves as the user’s personal account center within the app. It displays information tied to the authenticated user, such as their username, and may include a summary of their activity, including total workouts or number of different exercises. Its purpose is to provide a centralized location for identity, personalization, and account-related controls, reinforcing a sense of ownership over the user’s data and progress.
The purpose of this page is to keep certain peices of data in one page for the user to see. There is an importance in fitness applications for personal record tracking, so displaying these records to the user as well as the total weight is something specifically catered towards the fitness community.
Awards
The Awards page is designed to motivate users by recognizing milestones and accomplishments achieved through consistent training. Awards may be earned for completing a certain number of workouts, maintaining streaks, or reaching performance benchmarks such as personal records. Its purpose is to gamify the fitness experience, making progress feel rewarding and encouraging users to remain consistent with their routines.
This page relies on workout data stored in the Workout Log and analyzed in the Progress section to determine eligibility for achievements. When users add or remove workout entries, award qualifications may update accordingly. By connecting effort to recognition, the Awards page reinforces positive habits and enhances long-term engagement with the app.
Gameification is an important peice of fitness applications. By adding awards and accomplishments, it provides the user with a sense of motivation as well as engagement. Keeping a user in the app for a long period of time will first help them progress in the gym, and two make the app’s data more accurate because of the longer period of time. So creating something to engage the userbase was done through the awards section.
Suggestions
The suggestions page functions as an educational and guidance tool within the app. It provides users with recommended exercises organized by muscle group, helping them structure workouts and explore new movements. Each suggestion may include helpful tips or instructional resources to ensure proper form and safe execution. Its primary purpose is to support users in building effective and well-rounded training routines.
While this page does not store or analyze user data directly, it complements the workout log by influencing what users choose to record. By offering structured guidance and variety, the suggestions page enhances the overall training experience and helps users make informed decisions about their workouts. This allows beginners in the gym to choose from a suggested list of exercises to get started in their gym journey.
Data Flow and Processing Pipeline
This section introduces the data flow and processing pipeline used in the WorkoutTracker application. It explains how user-entered workout data moves through the system, from initial input to final output, and how each stage contributes to the app’s overall functionality. Rather than focusing solely on individual code segments, this section emphasizes the logical flow of data and the design decisions behind it, supported by a flowchart and selected code examples. This approach provides a clear understanding of how raw workout data is transformed into meaningful metrics, summaries, and visualizations presented to the user.
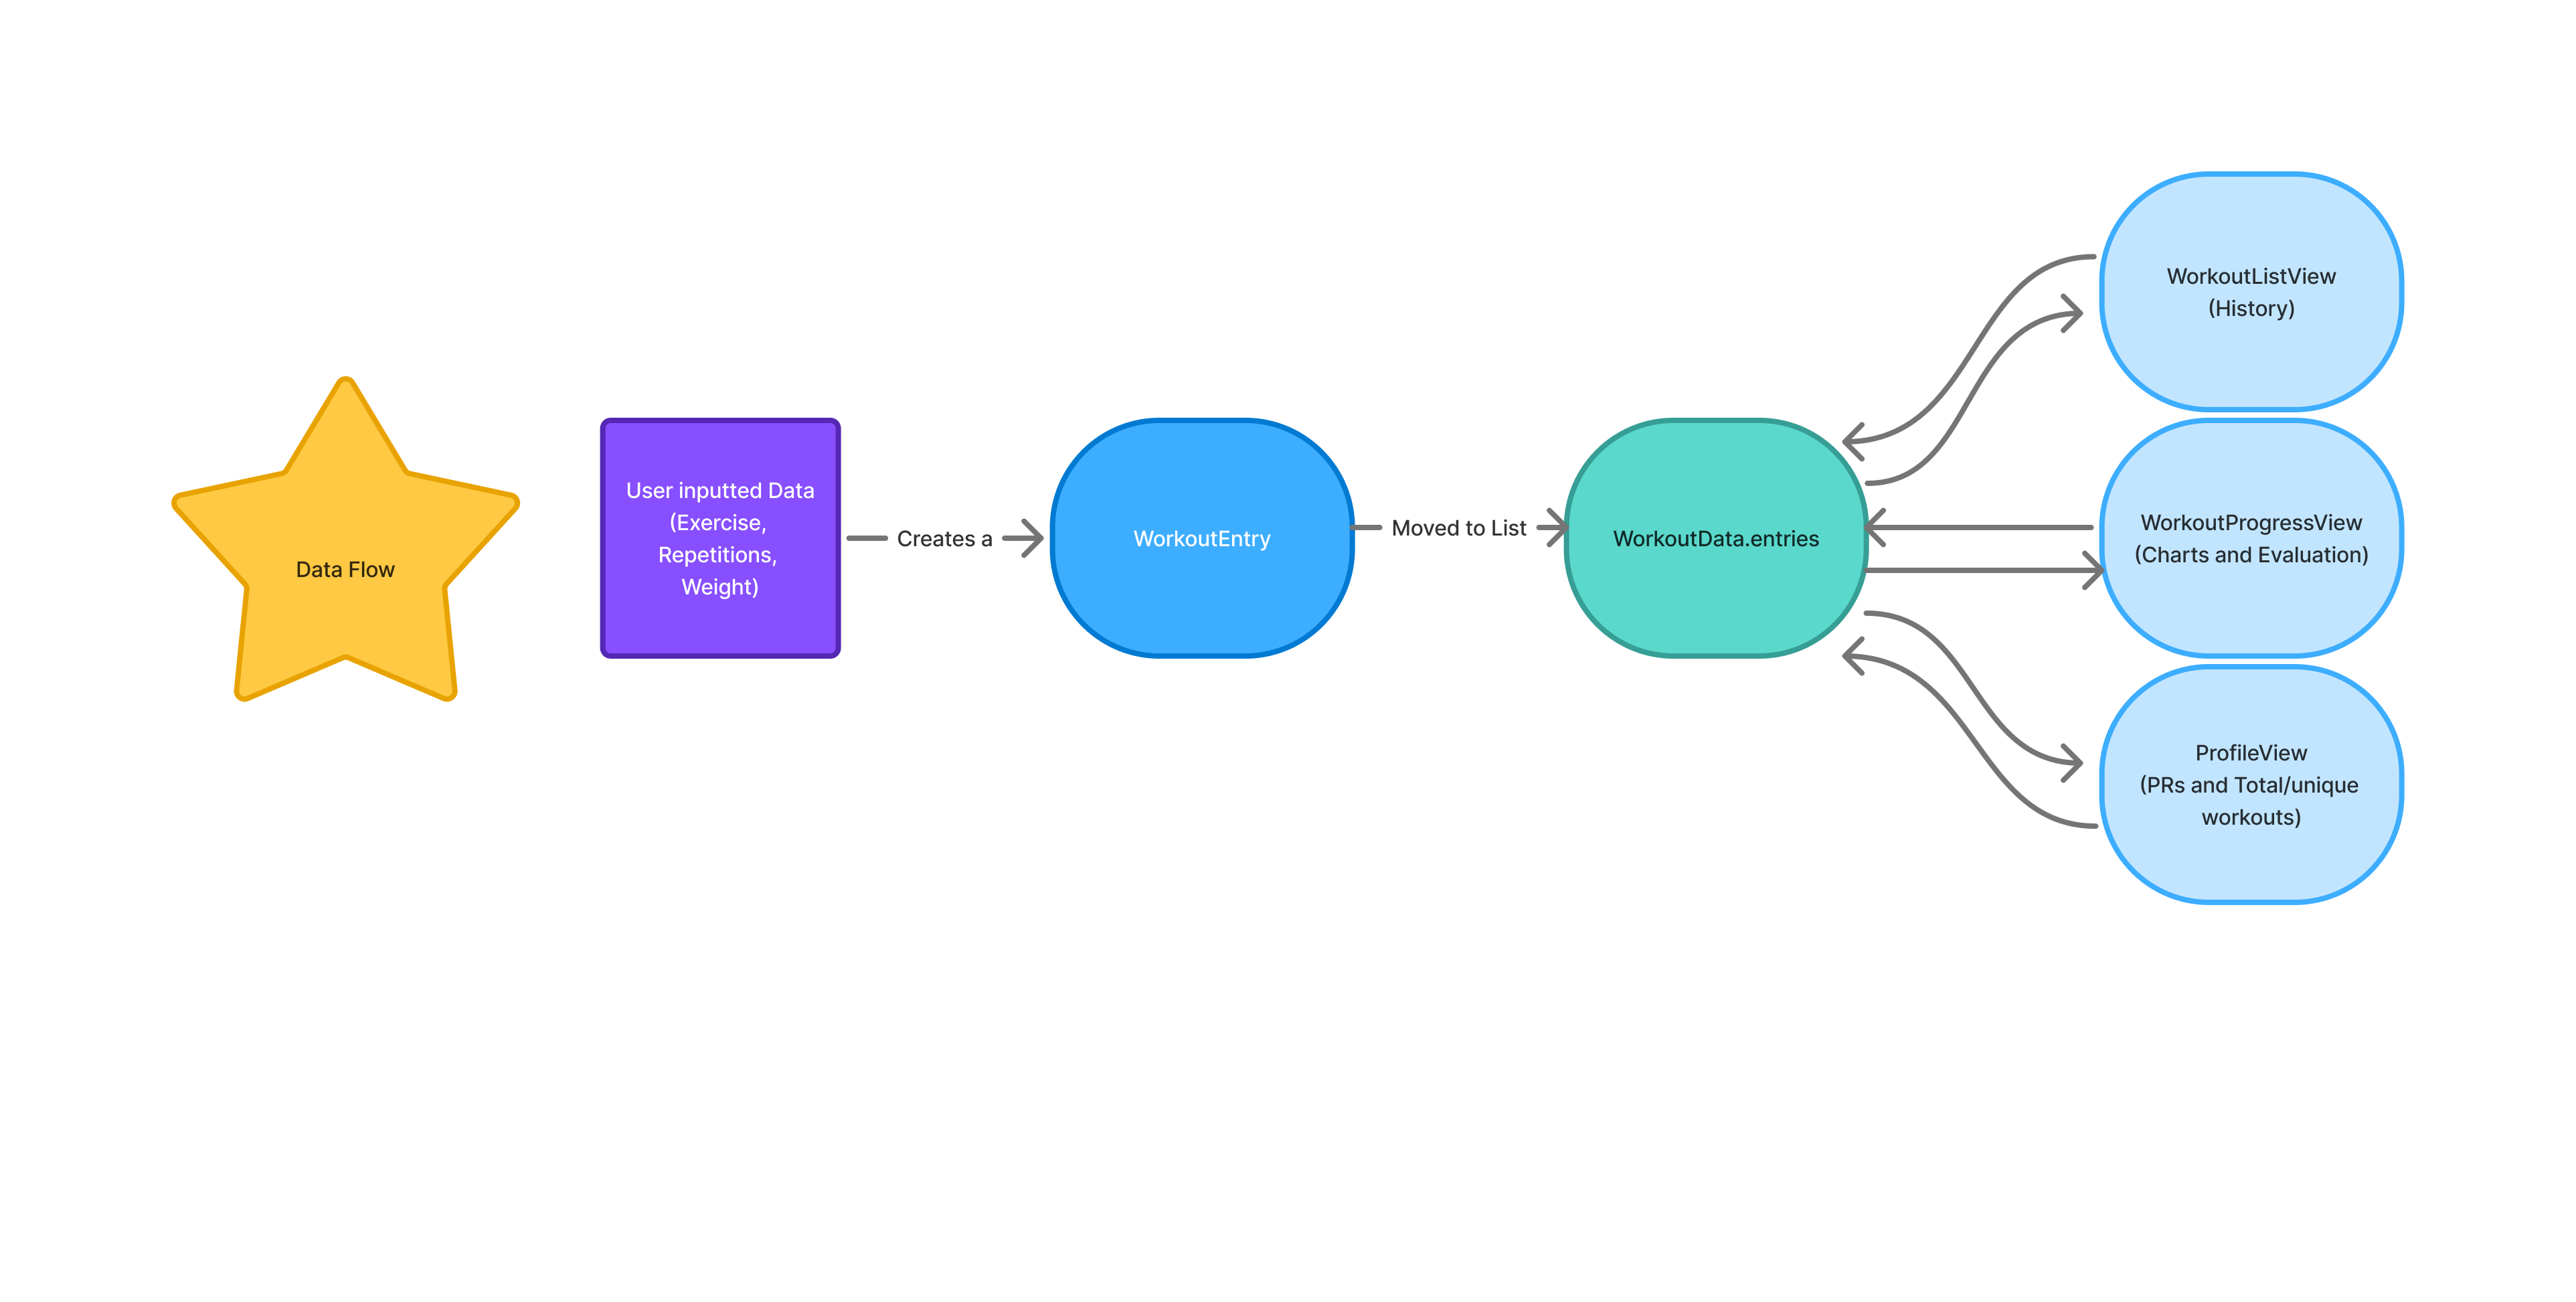
Let’s start with how the data gets inputted from the user. As seen in the flowchart, the user-inputted data starts all the following processes. In WorkoutTracker, data querying does not run continuously. This means that everything becomes powered and runs when the user presses the save button which finalizes the data they are inputting. This folows what is called an event-driven model, where queries are triggered only when specific events occur, in this case being when the user logs a workout. Other cases within this app are when the user navigates to the progress page to view visualizations. When no new data is being entered or requested, the querying logic becomes idle, consuming no processing resources. This design was carefully developed to ensure efficient resource usage, avoiding unnecessary computation, and improves battery performance which is critical when working in app development. This also aligns with modern mobile app development standards, where data processing is reactive rather than continuously running.
1  let entry = WorkoutEntry(
2    date: Date(),
3    muscleGroup: cleanMuscleGroup,
4    exercise: cleanExercise,
5    weight: Double(weight) ?? 0,
6    reps: Int(reps) ?? 0,
7    heartRate: Double(heartRate)
8  )
This code structures every data input that app recieves from the user. As you can see in the flowchart, once the user adds a workout, it creates a “WorkoutEntry”. This function processes every input that is recieved and structures them the same way every time. This allows for easy coding when it comes to looping through the data to find specific inputs. Each input is made up of six parts with one of them being optional, date, muscle group, exercise, weight, reps, and the optional choice to input heart-rate. Every time an input is recieved, it is then transformed into this structure and then finally appended to list “Data.entries”.
This list as seen in the flowchart is the color teal. This list contains all of the data inputs that the user has ever provided the app. So as the user continues to add hundreds of inputs the list continues to get larger. WorkoutData.entries is an in-memory data structure rather than a JSON object. It is implemented as a Swift array containing strongly typed workout entry models, such as structs that represent individual workout records. This array exists only while the application is running and is used by the app’s logic and user interface to query, process, and display workout information efficiently. JSON is involved only when this data needs to be persisted or loaded; in that case, the Swift objects stored in WorkoutData.entries are serialized into a JSON file for local storage and later deserialized back into Swift objects when the app is relaunched. This separation between runtime data structures and storage format ensures type safety, efficient processing, and clean state management within the application.
By appending each incoming input to the same list in the same structure, it enables much easier coding when it comes to PR querying, or data visualization. It only requires a for each loop to then parse through the list and check for any specific detail the developer wants. For example if the developer was looking to collect all of the exercises that are working out a specific muscle group it would look like this.
1  workoutData.entries.forEach { entry in
2    if entry.muscleGroup == targetMuscle {
3       matchingExercises.append(entry)
4    }
5  }
Within this code snippet, you can see that it is parsing through every entry within the list and looking for the targetMuscle, which would have been initialized before the loop. If the targetMuscle was declared as “legs,” then the matchingExercises list would solely contain all the exercises that have muscleGroup as legs. Swift makes for each loop very simple by only requiring three things for this specific example. First, what are you parsing through in this case, specifically, the name of the list. Secondly, you need to specify what you want the for each loop to do once it gets to a data input, in this case, looking for a specific muscle group, and then finally appending the data only if it matches the desired muscle group.
Moving forward in the flow chart, we can see that this list WorkoutData.entries, fuels the rest of the processes. There are three different pages that take data from this list: History, Progress (charts and evaluation), and Profile. All of these different sections of WorkoutTracker actively us different queries to update data.
WorkoutListView (history) is the page where the user is able to view a log of all the workouts they have entered into the app. Within this page users have the ability to delete specific entries if they mis-entered information or wish to remove an entry. All that this page is doing is displaying the list of entries in a neat and easily readable output. There are two important code parts that go into this page.
1  var body: some View {
2    NavigationView {
3      ZStack {
4        // Full screen gradient
5        AppColors.gradient
6          .ignoresSafeArea()
7        List {
8          ForEach(workoutData.entries) { entry in
9            WorkoutCard(entry: entry)
10              .listRowBackground(Color.clear)
11              .listRowSeparator(.hidden)
12          }
13          .onDelete(perform: workoutData.delete)
14        }
15        .listStyle(PlainListStyle())
16      }
17      .navigationTitle("Workout History")
18      .navigationBarTitleDisplayMode(.inline)
19    }
20  }
This SwiftUI code defines the user interface for a “Workout History” screen. The main view is a NavigationView containing a ZStack, which allows layering of elements. At the back of the stack, a full-screen gradient defined by AppColors.gradient is displayed and extended to cover the safe area using .ignoresSafeArea(). On top of this gradient, a List presents all workout entries stored in workoutData.entries using ForEach, where each entry is represented by a custom WorkoutCard view. Each list row is customized to have a transparent background (.listRowBackground(Color.clear)) and no default separator (.listRFowSeparator(.hidden)), giving it a clean, card-like appearance. Users can also delete entries with swipe actions via .onDelete(perform:). The list uses PlainListStyle() to remove extra padding and the default list styling, and the navigation bar is set with the title “Workout History,” displayed inline for a compact appearance.
This view shows a user-friendly “Workout History” screen where each workout is displayed as a card. The colorful gradient in the background makes the screen visually appealing, while the list of workouts scrolls on top of it. Each card is easy to read because the rows are transparent and have no separators, giving a clean, modern look. Users can also swipe to delete workouts, and the navigation bar at the top clearly shows the title of the screen. Overall, this layout combines style and functionality in a simple, organized way.
1  VStack(alignment: .leading, spacing: 6) {
2      HStack {
3          Text(entry.exercise)
4              .font(.headline)
5              .foregroundColor(.white)
6          Spacer()
7          Text("\(Int(entry.weight)) lbs x \(entry.reps)")
8              .font(.subheadline)
9              .foregroundColor(.white.opacity(0.9))
10     }
11
12     HStack(spacing: 12) {
13         if let hr = entry.heartRate {
14             Label("\(Int(hr)) bpm", systemImage: "heart.fill")
15                 .font(.caption)
16                 .foregroundColor(hr > 140 ? .red : .green)
17         }
18
19         Label(entry.date.formatted(.dateTime.month().day().year()),
20           systemImage: "calendar")
21             .font(.caption)
22             .foregroundColor(.white.opacity(0.8))
23     }
24 }
This SwiftUI code defines the layout of a single workout entry in a vertical stack (VStack) with a small spacing of 6 points between its elements, aligned to the leading edge. The first horizontal stack (HStack) displays the exercise name on the left in a bold headline font with white text, and on the right, it shows the weight lifted and the number of repetitions in a slightly smaller, semi-transparent white font. A Spacer() between them pushes the two pieces of text to opposite sides. Below that, a second HStack with a spacing of 12 points shows additional details: if the workout entry includes a heart rate, it displays it with a heart icon in a caption font, coloring it red if the rate is above 140 bpm and green otherwise. Next to that, a calendar icon with the formatted workout date is displayed, also in a caption font and semi-transparent white. Overall, this layout creates a clean, organized card showing both the main workout information and supplemental details like heart rate and date.
The first code snippet defines the overall screen layout, using a NavigationView with a scrollable List that displays all workout entries, while the second snippet defines what each individual entry looks like inside that list as a WorkoutCard. Essentially, the List in the first snippet loops over all workoutData.entries and places a WorkoutCard for each one, creating a full workout history view. The WorkoutCard layout, shown in the second snippet, organizes the exercise name, weight, reps, heart rate, and date in a clean, readable format using vertical and horizontal stacks. Together, the two snippets work in tandem: the first handles the overall structure, scrolling, and navigation, and the second handles the content and styling of each row, resulting in a cohesive, visually appealing workout history screen.
Moving forward from the history page, the ProgressView file is really what this moile application is specifically focused on. This page produces the evaluation and visuals for the user to read. All of the algorithms within this file all start when a user enters in data. This is important to once again note that when the user enters in data it is exactly like a car starting its engine. It provides power to the screen display, activates the underlying logic of the program, and triggers the sequence of operations that follow. Without that initial input, the system remains idle, waiting for instruction. Once the data is entered, the algorithms process it step by step, transforming raw input into meaningful output that is then presented back to the user. In this way, user input serves as the driving force that moves the entire program forward.
func entries(for exercise: String) -> [WorkoutEntry] {
        workoutData.entries
            .filter { $0.exercise == exercise }
            .sorted { $0.date < $1.date }
    }
Regarding the visual portion, the most important thing was to create a visual for each separate exercise that the user enters. When the user navigates to the progress tab, they are prompted to first select the exercise that they would like to view the visual and evaluation for. Once the user selects this exercise, for example, bench press, the app will then select from the list of workoutData.entries all the pieces of data that are entered for that selected exercise. As you can see, within this code, the program utilizes a simple but efficient for loop. This for loop will parse through the list of entries and select only the ones for the specified exercise. This allows the program to effectively display all of the data for the specified exercise.
In other functions, the progress tab will also retrieve information such as weight, repetitions, and date for the specific data piece to add it to the graph. The graph powers the user with the ability to visualize trends within their exercise history and receive feedback on why that might be happening. The data is then also used by the evaluation portion of this file. Many different algorithms are used to calculate trends within the user’s data, provide feedback on whether their muscles may be fatigued, and much more essential knowledge. The program completes this by initializing multiple variables up front, like momentum and latestEntry that are then used to calculate different feedback, like fatigue and volume. These variables are all grabbing the data from the list of workout entries, so once new data is entered, these variables may change to stay up to date with the data.
The last page that gets powered by the user-inputted data is the profile page. The profile page is something important to include when creating a mobile fitness application. It allows the user to easily discover, in this fitness app specifically, personal records, the number of workouts, and cumulative personal record data. This page uses the data in a very simple way, designed specifically to be important but simple.
let squatPR = workoutData.entries
    .filter { $0.exercise.lowercased().contains("squat") }
    .map { $0.weight }
    .max() ?? 0.0
This code calculates a user’s squat personal record (PR) by analyzing their stored workout data. It begins by accessing the entries array inside workoutData, which likely contains all logged workouts. It then filters that list to include only exercises whose names contain the word “squat,” converting each exercise name to lowercase to ensure the search is case-insensitive. After narrowing the list to only squat-related movements, the code maps those entries to extract just the weight values. From that list of weights, it uses .max() to determine the highest value, which represents the user’s heaviest recorded squat. If no squat entries are found and .max() returns nil, the nil-coalescing operator (??) ensures the result defaults to 0.0. Overall, this line of code efficiently finds the maximum squat weight the user has logged, providing their squat PR.
A significant portion of this project and application focuses on data and data analysis. By breaking this application down piece by piece we are able to see how the user-inputted data is the center of attention in this application.
Algorithms and Analytical Methods
The trend analysis and evaluation system is the most analytically sophisticated component of WorkoutTracker, and represents the feature that most clearly differentiates this application from a basic workout logging tool. Implemented within WorkoutProgressView.swift, this system transforms a user’s raw workout history into a structured, session-by-session performance assessment. The following subsections explain the logic, design decisions, and justifications behind each analytical layer.
Exercise Filtering and Chronological Sorting
Before any trend analysis can occur, the application must isolate the relevant subset of data for the exercise the user has selected. This is handled by two complementary functions. The entries function, a for loop, filters WorkoutData.entries to include only records matching the selected exercise name, then sorts them in ascending chronological order. This sorted sequence becomes the data source for the progress chart, ensuring that the visualization accurately reflects the progression of the user’s training. A companion function, history which is also a for loop, performs the same filtering but sorts in descending order, returning the most recent session first. This ordering is intentional meaning the evaluation logic always begins from the latest entry and works backwards, making the most recent session the reference point against which all prior sessions are compared.
The choice to maintain two separately ordered views of the same data, rather than sorting on the fly within each function, reflects a deliberate design decision to keep the chart logic and the evaluation logic independent of one another. The chart needs ascending order to plot points left to right over time and the evaluator needs descending order to prioritize recency. Separating these concerns makes both functions simpler and less error-prone.
Session-to-Session Comparison
The core of the evaluation logic begins with a direct comparison between the latest session and the one immediately preceding it. The function retrieves the two most recent entries from the descending history and compares weight and repetitions side by side. This produces the opening line of the evaluation feedback, which is dynamically selected based on the outcome of that comparison. If both weight and reps increased, the feedback reflects progressive overload which is the gold standard of strength training. If only weight increased, the feedback identifies strength development. If only reps increased, endurance improvement is noted. If neither increased, the system identifies the session as a maintenance effort and recommends a focus on technique.
This comparison-first approach is justified because session-to-session comparison is the most immediately meaningful signal to a fitness user. It directly answers the question every athlete asks after a workout: did I do better than last time? By leading with this signal and framing it in motivational language, the evaluation delivers actionable context before introducing any more complex metrics.
Volume Calculation
Beyond raw weight and reps, the system calculates training volume for each session as the product of weight multiplied by repetitions. Volume is a well-established metric in exercise science for quantifying total mechanical work performed in a session. Comparing the current session’s volume against the previous session’s volume gives a more complete view of performance change than weight or reps alone meaning a user who lifts slightly less weight but performs significantly more repetitions may actually have produced greater training stimulus, and volume captures this.
The volume comparison result feeds directly into the evaluation text, informing the user whether their overall training load increased or decreased relative to their last session, and by how much. This was an important metric to include as volume is an important aspect of any weightlifting session.
Momentum Calculation
One of the more analytically complex components of the evaluation system is the momentum metric. Rather than comparing only the two most recent sessions, momentum is calculated by comparing the average volume across the five most recent sessions against the average volume of the five sessions before that. This produces a measure of performance trajectory that is more valuable for the user than a comparison between the last 2 workouts.
The momentum value is expressed as a percentage change between the two rolling windows. A value above 0.15 indicates rapidly accelerating performance, a value between 0.05 and 0.15 indicates steady positive progress, and a value below -0.10 signals a meaningful decline that may indicate fatigue or insufficient recovery. This tiered interpretation ensures that the feedback adapts to the magnitude of the trend rather than applying binary labels to continuous data.
Using a rolling window approach rather than a cumulative average is justified by the recency principle in sports science that recent training sessions are more predictive of current fitness state than the entirety of training history, which may include periods of deconditioning, injury, or significant load changes.
Predictive Next Session Estimation
The evaluation system also generates a prediction for the user’s next session using a simple linear regression over the five most recent entries. The slope of the weight trend and the slope of the reps trend are each calculated independently and applied to the most recent session’s values to project what the following session might look like.
The implementation computes the slope, and applies it over an indexed sequence of sessions rather than raw dates, which avoids potential problems caused by irregular training intervals. The predicted weight is then rounded to the nearest five-pound increment which is a practical decision reflecting the standard plate increments available in most gym settings. Predicted reps are rounded to the nearest whole number. Minimum floors of five pounds and one repetition are enforced to prevent the model from generating nonsensical outputs during periods of decline.
This prediction is intentionally modest in scope. It does not attempt to model long-term periodization or account for biological variability. Instead, it provides a single concrete data point which is a suggested target for the next session that is built in recent trend data and presented as a guide. For a user-facing fitness application, a simple, interpretable prediction is more valuable than a complex model whose outputs cannot be easily explained or verified by the user.
Fatigue and Recovery Index
The final analytical layer in the evaluation system is a fatigue index, calculated by dividing the user’s total training volume over the past seven days by their recent average session volume, then scaling the result to a 0-to-100 range. A score below 40 indicates a manageable training load with adequate recovery capacity; scores between 40 and 70 suggest elevated load that warrants attention; scores above 70 signal potential overtraining and recommend rest.
The fatigue index is important because volume and momentum metrics alone cannot distinguish between productive high-frequency training and accumulated fatigue. Two users might show identical momentum scores, but one may have achieved that momentum with three sessions per week while the other trained seven days consecutively. The fatigue index surfaces this distinction, providing context that the other metrics do not capture.
By evaluating these metrics and providing the user with this information, WorkoutTracker is able to complete a task that no other mobile fitness applications have been able to complete. Providing careful justification within this section is important to understand why and how many of these metrics are being completed, as well as to demonstrate the uniqueness of this project.
The code for this experiment was developed and is published in a public repository at the following link: https://github.com/EvanNelson04/WorkoutTrackerExperiment.
Experiments
Experimental Setup
This experiment is tailored specifically to the technical components and development environment used in the WorkoutTracker application. Since the project was designed, implemented, and tested entirely within Xcode using the simulator, the experimental setup focuses on the conditions required to reproduce the app’s behavior and performance measurements. In order to make the results clear and repeatable, this section describes the hardware and software environment, the method used to generate the datasets for testing, and the benchmark methodology used to evaluate system performance. Together, these elements define the foundation of the experimental process and ensure that the reported results can be understood, replicated, and fairly interpreted. The benchmark implementation used for these experiments is also available in a separate public repository to support transparency and reproducibility: [https://github.com/EvanNelson04/WorkoutTrackerExperiment]. This repository contains the experimental benchmarking code used to generate the performance results discussed in this chapter.
Hardware and Software Environment
The experiments for this project were conducted on Apple hardware using Xcode and the iPhone Simulator to ensure a consistent and reproducible testing environment. The hardware platform used was an Apple MacBook Air equipped with an Apple M4 chip and 16 GB of RAM. This machine provided sufficient processing power and memory to build, run, and evaluate the application without hardware-related limitations affecting the benchmark results. Rather than deploying to a physical iPhone for the reported experiments, the application was executed through the iPhone Simulator included with Xcode, allowing controlled and repeatable testing conditions across multiple runs.
On the software side, the development environment consisted of macOS as the host operating system, Xcode as the integrated development environment, Swift as the programming language, and the iOS SDK version bundled with the installed Xcode release. Unless otherwise stated, the application was compiled and tested using the Debug build configuration, since this was the configuration used during development and simulator-based experimental runs. Recording these hardware and software details is important so that another reader or developer can recreate the same setup and reproduce the experimental procedure under comparable conditions.
Dataset Generation
It is important to talk about this data generation as it is the central point of the experiment. This data needed to be created and generated in the same format as the data the users will enter into the app to simulate real data. By simulating this real data, it will make this experiment as close to what a user’s real app will look like. Being able to simulate the look of real data for this experiment is important for strengthening my argument and experiment. This synthetic data generation process ensures that the benchmark results reflect realistic usage conditions rather than an artificial test environment.
static let exercises = [
        "Bench Press", "Squat", "Deadlift", "Overhead Press",
        "Pull Up", "Barbell Row", "Leg Press", "Incline Bench",
        "Dumbbell Curl", "Tricep Pushdown", "Lat Pulldown", "Cable Fly"
    ]

    static let muscleGroups = ["Chest", "Back", "Legs", "Arms",
    "Shoulders", "Core"]
This is where the data generation starts. The data generation was designed to be simple and efficient. As you can see in the code above, there is a set list of exercises that the data gets generated from, as well as a set list of muscle groups. When the data is being generated the loop will cycle through this list of exercises, generating piece by piece in a fashion that equally generates data for each set exercise. This is also most accurate to what a real user’s data might look like. Ideally data should be spread out evenly over different exercises using different muscle groups. Initializing a set list of exercises makes the data generation easier, as it is just assigning a exercise to the piece of data.
Next, it is important to display what this data looks like in the code. Like noted before, the data is built to the same format as the real data within the app. Like previously mentioned, this will best mirror a user’s real data.
entries.append(WorkoutEntry(
    date: date,
    muscleGroup: muscleGroup,
    exercise: exercise,
    weight: weight,
    reps: Int.random(in: 3...12)
))
This code above is the format for every piece of generated data that this experiment uses. It outlines and uses the same parameters that the real user data utilizes. Within this code segment you can see that it generates different parameters such as date, muscleGroup, exercise, weight, and reps. These are all of the important things that the app needs to produce a full and accurate evaluation so the user can progress over their time of using the app. By making the data all in the same format, it makes the generation process super simple and can be done in only a few steps.
Benchmark Methodology
The benchmark methodology begins by generating synthetic workout data and appending it to the dataset list used by the application. This process fills the app with realistic test data before any measurements are taken, ensuring that the benchmark reflects how the app performs when it is already populated with entries similar to those a real user would create. For this experiment, the dataset size was set to 100, 1000, and 10000 entries so that performance could be observed under a controlled and repeatable condition.
Performance was measured in milliseconds to provide precise timing results for each tested operation. Each benchmark test was executed 5 times, and the final reported values were calculated as the average of those 5 runs. Averaging the results helped reduce the effect of temporary system variation and produced a more reliable representation of the app’s typical performance. As learned in many classes including data analysis, taking the average of 5 or more runs creates a more accurate depiction of the performance. When an experiment is only run once, this contains the possibility of having outliers in your data. By running the benchmarking experiment multiple times, it allows the times to be much more accurate.
The benchmark includes three main performance categories: load time, query performance, and chart rendering. Load time measures how long the application takes to read and display the stored workout data after launch. Query performance measures how quickly the app can search, filter, or retrieve workout-related information from the dataset. Chart rendering measures the time required for the app to generate and display visual progress charts based on the stored entries. Together, these three categories provide a clear view of the app’s responsiveness and efficiency during its most important functions.
Within the query performance category, several specific queries were selected because they represent the most important data-processing tasks used throughout the application. These queries were chosen to ensure that each major area of the app was tested without overlooking any essential operation. The first set of queries focuses on filtering. One filtering query searches through the workout entries to isolate records for a specific exercise so that the correct graph data can be displayed to the user. A second filtering query groups exercises by muscle group, allowing the application to organize and present workout data based on categories such as chest, back, or legs. These filtering operations are central to how users interact with their workout history and progress.
Another important query included in the benchmark is the descending sort query used in the workout log. This query organizes the stored entries so that the most recent workout data appears first, which is a key part of making the workout log practical and user-friendly. Since users are most likely to review their newest workouts, this sorting behavior is an important operation to measure.
Additional benchmarked queries were taken from the profile page, where the application calculates several performance-based statistics. One query finds the maximum weight recorded for a specific exercise, which represents the user’s personal record. Another determines the number of unique exercises completed, giving insight into workout variety. A third calculates the combined total of the user’s bench press, squat, and deadlift maximums, commonly referred to as the “big three” total in weightlifting. The final profile-related query counts the number of unique workout days in a month, which helps summarize consistency and training frequency. These queries were included because they measure the speed of retrieving some of the most meaningful fitness metrics displayed by the application.
By defining these queries in advance and testing each one individually, the benchmark methodology provides a structured way to evaluate how efficiently the application handles its core features. This allows the results section to not only report the measured query times, but also explain why each query matters to the overall user experience and performance of the app.
Experimental Results
In this section, the results of each category will be analyzed and discussed to demonstrate this application’s ability to maintain strong performance under high-stress conditions. As this experiment was performed with 3 different dataset sizes, this evaluation and analysis is broken into three sections with the corresponding dataset size. By completing this analysis in this fashion, it will best align with the code output, which will make the analysis much easier. One important point to note, so that it does not need to be repeated in each section, is that a common performance standard for application responsiveness is to keep loading times under 100 milliseconds. As long as the load time and query time remain below this threshold, the user is unlikely to notice any lag during normal app use.
To provide some context for the upcoming visuals there are a few things to point out. To display the results of the experiment, box and whisker plots were utilized. Within this visual there are four main things to point out. First is the line to the furthest-right of the plot. This line shows you the highest number, in this case the slowest recorded time. On the contrary, the line furthest to the left will display the smallest number, which is the fastest recorded time for this experiment. In between these two lines there is a purple box. This box represents the middle 50 percent of the recorded values, meaning it shows where the central portion of the data falls. Inside this box there is also a line, which represents the median. The median is the middle value of the dataset when all recorded times are arranged from smallest to largest, and it helps show the central tendency of the results.
Load Time Performance Results
┌─────────────────────────────────────────────────────────────┐
│  DATASET SIZE: 100 entries                                  │
├─────────────────────────────────────────────────────────────┤
│                                                             │
│  📦 LOAD TIME (encode + UserDefaults write + decode)        │
│     Runs: 4.48 ms, 0.934 ms, 0.861 ms, 0.830 ms, 0.805 ms   │
│     Avg : 1.58 ms                                           │
└─────────────────────────────────────────────────────────────┘
As shown in the benchmark output above, five separate load time measurements were recorded for the dataset containing 100 entries, followed by the average of those five runs. The box-and-whisker plot below presents these same results visually and will be used throughout the remainder of the benchmark analysis for consistency. Among these five run times, the slowest recorded value was 4.48 milliseconds represented by the furthest-right line on the plot. This is likely due to the first run including additional startup overhead from the simulator and the initial execution of the loading process, which can make the first measurement slightly slower than the rest. After this initial run, the remaining four times are much closer together, ranging from 0.805 milliseconds to 0.934 milliseconds. This small range indicates that the load operation is highly consistent once the application has completed its initial startup behavior.
The median value, represented by the black line in the box and whisker plot, is 0.861 milliseconds. This is especially important because it shows that most runs are clustered at a much lower value than the average of 1.58 milliseconds. In this case, the average is raised by the unusually slower first run, meaning the median may better represent the typical load performance for this dataset size. Overall, these results demonstrate that with 100 entries, the application is able to load workout data extremely quickly and with very little variation between repeated runs. This suggests that at smaller dataset sizes, the loading functionality performs efficiently and would not create any noticeable delay for the user. It is also important to note that x axis numbers are in milliseconds.
┌─────────────────────────────────────────────────────────────┐
│  DATASET SIZE: 1000 entries                                 │
├─────────────────────────────────────────────────────────────┤
│                                                             │
│  📦 LOAD TIME (encode + UserDefaults write + decode)        │
│     Runs: 5.35 ms, 5.64 ms, 9.83 ms, 6.83 ms, 6.89 ms       │
│     Avg : 6.91 ms                                           │
└─────────────────────────────────────────────────────────────┘
Moving onto the next dataset size, five separate load time measurements were recorded for the dataset containing 1000 entries, followed by the average of those five runs. Among these five run times, the highest recorded value was 9.83 milliseconds, which is noticeably higher than the other four runs. This suggests that one run experienced slightly more overhead than the others, while the remaining measurements stayed within a much narrower range of 5.35 milliseconds to 6.89 milliseconds. This again is represented by the furthest-right line on the plot. The relatively small spread among those four runs indicates that the app loading time remains stable as the dataset size increases.
The median value for these five runs is 6.83 milliseconds, which provides a better representation of the typical load performance than the average in this case. This is because the average of 6.91 milliseconds is slightly influenced by the slower 9.83 millisecond run. Even with that higher result included, all five measurements remain well below the 100 millisecond threshold for noticeable delay, showing that the application continues to load data very quickly at this dataset size. Overall, these results demonstrate that with 1000 entries, the loading functionality remains efficient, consistent, and responsive, suggesting that the app can comfortably handle a moderate amount of stored workout data without causing visible lag for the user.
┌─────────────────────────────────────────────────────────────┐
│  DATASET SIZE: 10000 entries                                │
├─────────────────────────────────────────────────────────────┤
│                                                             │
│  📦 LOAD TIME (encode + UserDefaults write + decode)        │
│     Runs: 47.51 ms, 44.11 ms, 42.29 ms, 42.25 ms, 41.99 ms  │
│     Avg : 43.63 ms                                          │
└─────────────────────────────────────────────────────────────┘
Finally moving onto the largest dataset size of 10,000 entries. This is the largest dataset size that this experiment handles, which will provide a complete picture on how the WorkoutTracker application can function with lots of data. Looking at the 5 run times, they are all very close together as we can see in the plot. Since the dataset is a larger size, meaning the runtimes may vary more than you would see in a smaller dataset, the run at 47.51 milliseconds is not considered an outlier within this experiment.
The median within this dataset is run three at 42.29 milliseconds, which is very close to the average time of 43.63 milliseconds. This demonstrates that the results are very consistent, with no outlier heavily distorting the average. Although the load time has increased greatly, this is expected because of the growth in the size of the dataset. Knowing this, all five of the measurements at the largest dataset size still remain well below the 100 millisecond threshold for noticeable delay. This goes to show how efficient the code and functionality within the app works. We can predict from this data that it would take a much larger dataset to cause the load time to take over 100 milliseconds, causing delay within the application.
Query Time Performance Results
This section presents and analyzes the query performance results produced during the benchmark testing of the WorkoutTracker application. As mentioned before, hese queries were designed to reflect the types of data retrieval and processing tasks that users would commonly perform while using the app, such as filtering workouts by exercise or muscle group, sorting workout history, and calculating progress-based statistics. Evaluating these query times is important because it shows how efficiently the application can access and process stored workout data under realistic conditions. By measuring the execution time of each query across multiple runs, this section helps determine whether the app can maintain fast and responsive performance as dataset size and query complexity increase.
│  🔍 QUERY TIMES (5 individual runs each)                    │
│     Filter by exercise (Bench Press)       Avg 0.043 ms     │
│        Runs: 0.083 ms, 0.032 ms, 0.033 ms, 0.033 ms, 0.033 m│
│     Filter by muscle group (Chest)         Avg 0.009 ms     │
│        Runs: 0.010 ms, 0.009 ms, 0.009 ms, 0.009 ms, 0.009 m│
│     Sort by date descending                Avg 0.014 ms     │
│        Runs: 0.018 ms, 0.013 ms, 0.013 ms, 0.012 ms, 0.013 m│
│     Max weight per exercise                Avg 0.126 ms     │
│        Runs: 0.516 ms, 0.030 ms, 0.028 ms, 0.029 ms, 0.029 m│
│     Unique exercise count                  Avg 0.021 ms     │
│        Runs: 0.041 ms, 0.017 ms, 0.016 ms, 0.016 ms, 0.016 m│
│     Monthly unique workout days            Avg 0.102 ms     │
│        Runs: 0.165 ms, 0.086 ms, 0.086 ms, 0.086 ms, 0.085 m│
│     Big Three combined max weight          Avg 0.100 ms     │
│        Runs: 0.102 ms, 0.101 ms, 0.100 ms, 0.099 ms, 0.100 m│
│     ─────────────────────────────────────────────────────   │
│     Total query time (avg sums): 0.415 ms                   │
These query results are very strong. Overall, the average total query time is 0.415 milliseconds, which means the full set of tested queries completes in well under a single millisecond on average. That indicates the app’s data operations are highly efficient and would feel effectively instantaneous to a user during normal use.
Looking at the individual queries, the fastest operations are filtering by muscle group (0.009 milliseconds) and sorting by date descending (0.014 milliseconds), showing that simple filtering and ordering tasks place almost no measurable strain on the system. Unique exercise count (0.021 milliseconds) and filter by exercise (0.043 milliseconds) are also extremely fast, which suggests the app can quickly narrow down and summarize workout records without introducing delay. These are the kinds of actions users are likely to perform often, so their low times are especially important.
The more computationally demanding queries still performed very well. Monthly unique workout days (milliseconds), Big Three combined max weight (0.100 milliseconds), and max weight per exercise (0.126 ms) were the slowest of the group, but even these remained far below 1 millisecond. This shows that slightly more complex operations still execute at a very high level of performance and would not create any visible lag in the application.
One thing worth noting is the max weight per exercise query had one noticeably higher first run at 0.516 milliseconds, while the remaining runs were all around 0.028–0.030 milliseconds. This suggests once again the cold start effect startup or rather than a true performance issue, since the repeated runs were much lower and very consistent. A similar but smaller pattern appears in a few other queries where the first run is slightly slower than the rest. This is common in benchmarking and does not weaken the overall result.
In conclusion, these results demonstrate that the application handles query operations extremely efficiently. All measured queries are far below the threshold where a user would perceive delay, and the consistency across runs suggests stable performance. Even the most complex queries remain fast enough to support responsive filtering, sorting, and progress tracking features within the app.
│  🔍 QUERY TIMES (5 individual runs each)                    │
│     Filter by exercise (Bench Press)       Avg 0.326 ms     │
│        Runs: 0.333 ms, 0.349 ms, 0.317 ms, 0.316 ms, 0.316 m│
│     Filter by muscle group (Chest)         Avg 0.080 ms     │
│        Runs: 0.080 ms, 0.079 ms, 0.080 ms, 0.081 ms, 0.079 m│
│     Sort by date descending                Avg 0.142 ms     │
│        Runs: 0.147 ms, 0.140 ms, 0.141 ms, 0.137 ms, 0.143 m│
│     Max weight per exercise                Avg 0.244 ms     │
│        Runs: 0.257 ms, 0.236 ms, 0.241 ms, 0.243 ms, 0.244 m│
│     Unique exercise count                  Avg 0.150 ms     │
│        Runs: 0.156 ms, 0.151 ms, 0.148 ms, 0.149 ms, 0.147 m│
│     Monthly unique workout days            Avg 0.438 ms     │
│        Runs: 0.447 ms, 0.429 ms, 0.431 ms, 0.449 ms, 0.435 m│
│     Big Three combined max weight          Avg 0.959 ms     │
│        Runs: 0.958 ms, 0.955 ms, 0.951 ms, 0.936 ms, 0.995 m│
│     ─────────────────────────────────────────────────────   │
│     Total query time (avg sums): 2.34 ms                    |
These query results continue to demonstrate excellent application performance. The total average query time is 2.34 milliseconds, meaning that all tested query operations together still complete in only a tiny fraction of a second. This shows that even as the dataset grows, the app remains highly responsive and capable of processing user-inputted data requests without noticeable delay.
Among the individual queries, filter by muscle group (0.080 milliseconds) and sort by date descending (0.142 milliseconds) were the fastest, showing that basic filtering and sorting tasks are handled very efficiently. Unique exercise count (0.150 milliseconds) and max weight per exercise (0.244 milliseconds) also performed well, indicating that the app can quickly calculate summary-style information in addition to simple lookups. Filter by exercise (0.326 milliseconds) was slightly higher, but it still remained extremely fast and well within the range of instantaneous performance.
The more advanced summary queries required somewhat more processing time, which is expected. Monthly unique workout days (0.438 milliseconds) took longer than the simpler filters and counts, likely because it involves grouping or identifying distinct workout dates across the dataset. The slowest query was Big Three combined max weight (0.959 milliseconds), but even this result remained under a single millisecond on average. This is still an exceptionally fast execution time and suggests that even the most complex progress-tracking calculations in the application are highly optimized.
Another important observation is the strong consistency across the five runs for each query. The recorded times remain very close from one run to the next, which suggests stable and reliable query behavior rather than inconsistent spikes in performance. This consistency strengthens the validity of the benchmark because it shows the application is not only fast, but also predictable under repeated testing.
Overall, these results show that the WorkoutTracker application performs query operations at a very high level of efficiency. Every tested operation completed in under one millisecond individually, and the full query set averaged only 2.34 milliseconds in total. This indicates that users would be able to filter, sort, and analyze workout data smoothly, even when working with a larger dataset, with no visible lag during normal app use.
│  🔍 QUERY TIMES (5 individual runs each)                    │
│     Filter by exercise (Bench Press)       Avg 3.20 ms      │
│        Runs: 3.25 ms, 3.24 ms, 3.20 ms, 3.15 ms, 3.15 ms    │
│     Filter by muscle group (Chest)         Avg 0.823 ms     │
│        Runs: 0.843 ms, 0.829 ms, 0.817 ms, 0.813 ms, 0.815 m│
│     Sort by date descending                Avg 1.39 ms      │
│        Runs: 1.36 ms, 1.37 ms, 1.42 ms, 1.40 ms, 1.40 ms    │
│     Max weight per exercise                Avg 2.40 ms      │
│        Runs: 2.54 ms, 2.43 ms, 2.41 ms, 2.33 ms, 2.32 ms    │
│     Unique exercise count                  Avg 1.52 ms      │
│        Runs: 1.51 ms, 1.54 ms, 1.52 ms, 1.53 ms, 1.51 ms    │
│     Monthly unique workout days            Avg 3.96 ms      │
│        Runs: 3.93 ms, 3.95 ms, 3.99 ms, 3.96 ms, 3.97 ms    │
│     Big Three combined max weight          Avg 9.56 ms      │
│        Runs: 9.44 ms, 9.39 ms, 9.32 ms, 9.66 ms, 9.97 ms    │
│     ─────────────────────────────────────────────────────   │
│     Total query time (avg sums): 22.86 ms                   │
These results show that query performance remains strong even at the largest dataset size tested. The total average query time is 22.86 milliseconds, which means that all benchmarked queries combined still execute in far less than 100 milliseconds. From a user experience standpoint, this is important because it indicates that the app can continue to retrieve and process workout information quickly, even when handling a much larger volume of stored records.
Looking at the individual query categories, the simplest operations remained very efficient. Filter by muscle group (0.823 milliseconds) and sort by date descending (1.39 milliseconds) both completed quickly, showing that common browsing and organization tasks still place only a small load on the system. Unique exercise count (1.52 milliseconds) also stayed low, suggesting that summary counts can be generated with very little overhead. Although these values are higher than in the smaller datasets, they are still extremely fast in practical terms.
Some of the more data-intensive operations naturally required more processing time. Max weight per exercise (2.40 milliseconds) and filter by exercise (3.20 milliseconds) were higher than the simpler queries, but they still completed within only a few milliseconds. Monthly unique workout days (3.96 milliseconds) took slightly longer, which makes sense because it likely involves identifying and comparing distinct dates across many entries. The most demanding operation was Big Three combined max weight (9.56 milliseconds), but even this remained under 10 milliseconds on average. That result shows that more advanced calculations tied to progress tracking and workout analysis can still be performed very efficiently.
Another notable strength in these results is the consistency between runs. The values for each query remain close across all five trials, with only minor variation. This steady pattern suggests that performance is not only fast, but also dependable under repeated execution. Rather than showing major spikes or instability, the benchmark demonstrates that the system handles larger datasets in a controlled and predictable way.
Taken together, these findings suggest that the application scales well as data volume increases. Even at this larger dataset size, all individual queries remained under 10 milliseconds, and the full benchmark set averaged only 22.86 milliseconds in total. This supports the conclusion that the WorkoutTracker application can maintain smooth, responsive query performance under heavier data conditions without introducing noticeable lag for the user.
Chart Rendering Performance Results
Finally looking at the chart rendering section. These charts are designed in a specific way so that no matter how much data the user enters, the chart will always appear legible. The way this was completed was by keeping the amount of data points per graph to a maximum of 25 data points. As the first dataset size is only 100 entries, this will not force the graph to hit the maximum of 25 entries. You will notice in the output a few important pieces. The first being the average time, along with the 5 seperate runs of the benchmarking experiment. After that, the next line will display how many pieces of data for the exercise there are, compared to how many are shown. This will be important to note as the dataset gets bigger because there will be much more than 25 data points but not will be shown. This brings us to the next important piece, that is the percent of data retained. This is showing in a percentage output, how much of the data is on the graph, just by completing a simple formula which is the shown data divided by the total data, all multiplied by 100 to get the final percentage value. Keeping the maximum data points to 25, while keeping the chart legible, should also keep the load time relatively fast, causing no problems inside my application.
│   📈 CHART RENDERING (same logic as WorkoutChartView)       │
│     (capped at 25 pts)                                      │
│     Chart data for Bench Press   Avg 0.008 ms               │
│        Runs: 0.027 ms, 0.003 ms, 0.003 ms, 0.003 ms, 0.003 m│
│        [9 total → 9 shown, 100.0% retained]                 │
│     Chart data for Squat         Avg 0.003 ms               │
│        Runs: 0.003 ms, 0.003 ms, 0.003 ms, 0.003 ms, 0.002 m│
│        [9 total → 9 shown, 100.0% retained]                 │
│     Chart data for Deadlift      Avg 0.003 ms               │
│        Runs: 0.003 ms, 0.002 ms, 0.003 ms, 0.003 ms, 0.003 m│
│        [9 total → 9 shown, 100.0% retained]                 │
└─────────────────────────────────────────────────────────────┘
This chart rendering result shows extremely strong performance. The average render time stayed between 0.003 milliseconds and 0.008 milliseconds for all three exercises, which is essentially instantaneous from a user perspective. Bench press was the slowest of the three at 0.008 milliseconds average, but even that is still far below any noticeable threshold, while squat and deadlift both averaged 0.003 milliseconds, showing very consistent speed. The slightly higher first bench press run of 0.027 milliseconds was likely due to initial setup overhead during the first run rather than sustained chart rendering cost. This is a known phenomenon called the cold start effect. This is when initial setup work affects the first run of a benchmarking experiment, making it seem slower when in reality it is just as fast as the next runs of the experiment. This is supported by the remaining runs, which stabilized at about 0.003 milliseconds, indicating consistently fast performance once the process was initialized.The individual runs also stayed tightly grouped, which suggests the chart data generation logic is stable and reliable rather than producing random spikes in processing time.
Another important result is that the chart retained 100% of the available data points for each exercise, with 9 total points shown out of 9 available. This means the rendering logic did not need to trim or reduce the dataset in this case, so the app was able to display the full workout history for each exercise while still maintaining near-zero processing time. Overall, these results indicate that the chart rendering system is highly efficient and should have no negative effect on app responsiveness or user experience. As mentioned before, the chart will only handle a maximum of 25 values. Since these primary results performed strong, it is fair to predict that there should not be much change in the performance as the dataset sizes increase.
│  📈 CHART RENDERING (same logic as WorkoutChartView)        │
│     (capped at 25 pts)                                      │
│     Chart data for Bench Press   Avg 0.007 ms               │
│        Runs: 0.012 ms, 0.006 ms, 0.006 ms, 0.006 ms, 0.006 m│
│        [84 total → 25 shown, 29.8% retained]                │
│     Chart data for Squat         Avg 0.006 ms               │
│        Runs: 0.007 ms, 0.006 ms, 0.006 ms, 0.006 ms, 0.006 m│
│        [84 total → 25 shown, 29.8% retained]                │
│     Chart data for Deadlift      Avg 0.006 ms               │
│        Runs: 0.006 ms, 0.005 ms, 0.005 ms, 0.006 ms, 0.006 m│
│        [84 total → 25 shown, 29.8% retained]                │
└─────────────────────────────────────────────────────────────┘
This chart rendering result again demonstrates extremely strong performance, even with the larger 100-entry dataset. The average render time remained between 0.006 milliseconds and 0.007 milliseconds for all three exercises, which is still effectively instantaneous from the user’s perspective. Bench Press showed the highest average at 0.007 milliseconds, while squat and deadlift both averaged 0.006 milliseconds, indicating that rendering speed stayed nearly identical across exercises. The individual runs were also very closely grouped, with only minor variation between measurements, which suggests that the chart rendering process is stable and dependable rather than affected by irregular spikes in execution time.
Another important finding is that the chart displayed 25 points out of 84 total available values for each exercise, meaning 29.8% of the total dataset was retained for visualization. This reflects the chart’s built-in cap of 25 values, which is intentionally used to keep the graph readable and efficient even as the stored workout history grows larger. Despite working with a much larger pool of available data, the rendering time remained near zero, showing that limiting the displayed values successfully prevents performance from degrading. Overall, these results indicate that the chart rendering system remains highly efficient at this dataset size and should continue to have no noticeable impact on app responsiveness or user experience.
│  📈 CHART RENDERING (same logic as WorkoutChartView)        │
│     (capped at 25 pts)                                      │
│     Chart data for Bench Press   Avg 0.006 ms               │
│        Runs: 0.009 ms, 0.006 ms, 0.006 ms, 0.005 ms, 0.005 m│
│        [834 total → 25 shown, 3.0% retained]                │
│     Chart data for Squat         Avg 0.005 ms               │
│        Runs: 0.006 ms, 0.006 ms, 0.005 ms, 0.005 ms, 0.005 m│
│        [834 total → 25 shown, 3.0% retained]                │
│     Chart data for Deadlift      Avg 0.007 ms               │
│        Runs: 0.010 ms, 0.006 ms, 0.006 ms, 0.006 ms, 0.005 m│
│        [834 total → 25 shown, 3.0% retained]                │
└─────────────────────────────────────────────────────────────┘
These chart rendering results remain very solid even at the largest dataset size. The average render times stayed between 0.005 milliseconds and 0.007 milliseconds across all three exercises, which is still essentially instantaneous from a user perspective. Bench press averaged 0.006 milliseconds, Squat averaged 0.005 milliseconds, and Deadlift averaged 0.007 milliseconds, showing that performance remained highly consistent even with 834 total available values per exercise. Although the first run for bench press and Deadlift was slightly higher than the rest, this is most likely due to a cold start effect, since the later runs quickly stabilized at nearly identical times. The close grouping of the remaining runs further shows that the rendering process is reliable and does not experience meaningful slowdown as more workout history is stored.
Another important result is that only 25 of the 834 available values were displayed for each exercise, meaning 3.0% of the total data was retained for chart rendering. While this is a much smaller percentage than in the earlier tests, it reflects the intended design of the chart system rather than a limitation. Because the chart is capped at a maximum of 25 values, the amount of data actually rendered remains controlled and efficient regardless of how large the underlying dataset becomes. Overall, these results confirm that chart rendering stays fast, stable, and efficient at every dataset size tested, and the 25-value maximum is clearly the reason performance remains consistently strong even as the total number of stored entries grows.
Final Results Analysis
The load time results particularly support the conclusion that the application scales efficiently as more workout data is stored. At 100 entries, the average load time was only 1.58 milliseconds, and even at 10,000 entries, the average remained at 43.63 milliseconds. Although this increase is significant in relative terms, it is still comfortably below the point where a user would begin to notice lag. In addition, the repeated runs were generally close together, especially at the larger dataset sizes, showing that the loading process is not only fast but also stable. The slightly slower first runs or occasional higher values appear to be caused by startup overhead rather than flaws in the loading logic itself. Together, these results suggest that the app’s encoding, storage, and decoding process is efficient enough to support real-world use even as the amount of stored workout history grows substantially.
The query benchmark results strengthen this conclusion even further. Across all dataset sizes, the app was able to filter, sort, count, and summarize workout data in extremely small time ranges. At the smallest dataset size, the total average query time was just 0.415 milliseconds, and even at the largest dataset size, the total remained only 22.86 milliseconds. This means that the core user-facing data operations inside the app remain highly efficient under heavier workloads. Simpler operations such as filtering by muscle group, sorting by date, and counting unique exercises stayed especially fast, while more advanced calculations such as monthly workout days and Big Three combined max weight also remained well within a range that would feel instantaneous to the user. Just as importantly, the query timings stayed consistent across repeated runs, which suggests the app performs in a reliable and predictable way rather than producing random spikes in execution time.
The chart rendering results also provide strong support for the app’s performance under stress. In every dataset size tested, chart generation times remained extremely low, generally between 0.003 and 0.008 milliseconds. This shows that the charting logic introduces almost no measurable overhead to the application. An important reason for this is the design decision to cap each chart at a maximum of 25 displayed data points. That cap prevents performance from degrading as the total underlying dataset becomes much larger. At 100 entries, the charts could display all available values, while at 1,000 and 10,000 entries they displayed a smaller percentage of the total data but still preserved legibility and rendering speed. This design choice is important because it shows that the app was not only benchmarked successfully, but also engineered thoughtfully to maintain performance as the user’s workout history grows over time.
Taken together, these findings show that the WorkoutTracker application is well optimized and performs reliably under high-stress conditions. The results also show that performance scales in a controlled and manageable way as the dataset increases, rather than breaking down under larger workloads. This is especially important for a fitness tracking application, since users are expected to continuously add more workout data over time. Based on these results, it is reasonable to conclude that the app is capable of supporting long term use while maintaining a smooth and responsive experience. Overall, the experiment successfully demonstrates that the application performs at a high level across its major data heavy tasks and is strong enough for realistic, real-world scenarios.
Threats to Validity
Although the benchmark results show that the WorkoutTracker application performed well during testing, several threats to validity should be considered when interpreting the results. Acknowledging these limitations is important because it provides a more balanced evaluation of the experiment and helps clarify the extent to which the findings can be generalized to real use. The main threats in this study relate to the use of synthetic data, the dependence on a specific hardware environment, and the limited range of dataset sizes included in the benchmarks.
Synthetic Data
One important threat to validity is that the benchmark datasets were generated artificially rather than collected from real users. Synthetic data was necessary for this experiment because it allowed the tests to be performed in a controlled and repeatable way, while also making it possible to create larger dataset sizes for stress testing. In addition, the generated records were designed to match the same general structure and format as the workout entries that a real user would create within the application. This helped make the benchmark more realistic and relevant to the intended use of the system.
However, artificially generated data still has limitations. Real users may not log workouts in such a regular or predictable manner. Their records could contain more variation in exercise selection, workout frequency, repetition patterns, dates, and overall distribution of entries. Some users may consistently repeat the same exercises, while others may create highly uneven training logs over long periods of time. Because of this, real-world data could produce performance behavior that differs slightly from the benchmark results. As a result, the experiment provides a strong approximation of realistic use, but it does not guarantee that every possible user pattern would produce identical performance outcomes.
Hardware Dependencies
Another threat to validity is that the benchmark results depend on the specific hardware and software environment used for testing. The experiments were conducted on a single Apple MacBook Air with an Apple M4 chip, using Xcode and the iPhone Simulator. This created a stable and reproducible testing setup, which is valuable for consistency across repeated benchmark runs. By holding the environment constant, the experiment was able to focus more directly on the behavior of the application itself.
Even so, performance measurements are always influenced by the hardware on which they are collected. A different computer, processor, memory configuration, simulator setting, or operating system version could produce somewhat different results. In addition, performance on the iPhone Simulator may not exactly match performance on a physical iPhone, where factors such as device age, battery state, background tasks, and real mobile hardware limitations could affect timing. This means the reported values should be understood as results from the tested environment rather than universal performance guarantees across all devices. The findings strongly suggest good performance, but they may vary when the application is used on different hardware platforms.
Limited Dataset Sizes
A third threat to validity is the limited range of dataset sizes used in the experiment. The benchmarks were performed using datasets of 100, 1,000, and 10,000 entries. These sizes were chosen because they represent small, medium, and high-stress conditions and provide a useful basis for evaluating how the application scales as more data is stored. Testing across these increasing sizes made it possible to observe performance trends and determine whether the app remained efficient under heavier workloads.
However, the maximum tested dataset was 10,000 entries, and some long-term users could eventually exceed that number. A very active user who logs workouts frequently over many years might accumulate more records than were included in this benchmark. Because the experiment did not test beyond 10,000 entries, it cannot fully confirm how the app would behave at substantially larger scales. While the results suggest that performance increases in a controlled and manageable way, additional testing with even larger datasets would strengthen the conclusions and provide a clearer picture of the application’s upper limits.
Overall, these threats to validity do not invalidate the benchmark findings, but they do place reasonable boundaries on how the results should be interpreted. The experiment still provides strong evidence that the WorkoutTracker application performs efficiently under the tested conditions. At the same time, recognizing the use of synthetic data, the influence of the testing hardware, and the limited maximum dataset size helps ensure that the evaluation remains realistic, transparent, and academically sound.
Final reflection
Overall, this project represents a successful integration of software engineering, data analysis, and user-centered design to solve a real world problem in fitness tracking. Through the design and implementation of the WorkoutTracker application, combined with the structured benchmarking experiments, it is clear that the system is both technically efficient and practically useful. The results demonstrate that the application maintains strong performance across increasing dataset sizes while continuing to deliver a smooth and responsive user experience. Beyond the technical achievements, this project also highlights the importance of thoughtful design decisions, such as efficient data structures, controlled chart rendering, and meaningful query selection in building scalable applications. Overall, this work not only validates the effectiveness of the current system but also provides a strong foundation for future enhancements, reinforcing its potential to evolve into a real-world fitness solution.
Discussion and Future Works
Project Overview and Goals
The primary goal of this project was to address a clear gap in existing mobile fitness applications which is the lack of meaningful evaluation and trend analysis for user workout data. While many popular fitness apps provide effective tools for logging exercises and visualizing basic progress, they often fall short in delivering personalized insights that help users understand how they are improving and what they should do next. This project aimed to bridge that gap by developing a system that not only records workout data, but also interprets it in a way that is actionable and user-specific.
To achieve this, the application was designed to focus on user-inputted workout data, allowing individuals to log exercises, weights, and repetitions in a structured format. From this data, the system performs trend analysis by comparing recent workouts, identifying patterns over time, and generating simple predictive insights. These evaluations provide users with feedback on their performance, such as whether they are improving, plateauing, or regressing in specific exercises or muscle groups.
The completed application successfully fulfills this objective by integrating data tracking, visualization, and evaluation into a single cohesive platform. Features such as progress charts, personalized feedback, and performance comparisons demonstrate the system’s ability to transform raw workout data into meaningful insights. As a result, the project not only meets its original goal but also highlights the potential for more intelligent, user-centered fitness applications that go beyond basic tracking to actively support user progress and decision-making.
This project is also closely tied to my original motivation, as someone who regularly goes to the gym and has consistently sought meaningful evaluation of my own progress. While I could track weights, reps, and workouts over time, I often found it difficult to clearly understand whether I was improving at an optimal rate or what adjustments I should make next. This personal frustration highlighted a gap between simply collecting workout data and actually interpreting it in a useful way. As a result, this application was designed not just as a technical solution, but as a direct response to that need—providing the kind of structured feedback, trend analysis, and performance insights that I had always wanted in my own fitness journey.
Critical Evaluation of WorkoutTracker
Reflection
The development of WorkoutTracker provided a meaningful opportunity to critically evaluate not only whether the application met its original goal, but also how effectively each individual component contributed to that goal. At a high level, the application successfully addressed the problem of evaluation and trend analysis in mobile fitness apps by moving beyond simple data logging and introducing structured feedback and performance insights. However, a deeper reflection reveals that the success of the system is largely tied to specific design and implementation decisions, each with their own strengths and areas for growth.
One of the most effective aspects of the application was its use of local data storage. By storing workout data using JSON, the system achieved fast load times, simple data management, and a reliable user experience without the overhead of external dependencies. For the scope of this project, this approach worked extremely well, as it allowed for efficient querying, smooth chart rendering, and consistent performance across increasing dataset sizes. At the same time, this decision also highlighted an important trade-off being that while local storage is effective for a prototype and ensures user data privacy, it limits scalability and accesing data from different devices.
Another strong component of the application was the gamification system, particularly the implementation of awards and achievement notifications. Features such as progress tracking, milestone-based awards, and visual feedback through popups added an engaging layer to the user experience. These elements demonstrated how motivation and user retention can be enhanced through relatively simple mechanisms. The notification system was effective in providing immediate reinforcement when users reached milestones, making the experience feel more interactive and rewarding. However, reflecting on this feature also reveals opportunities for improvement, such as making awards more dynamic, personalized, and adding badges.
The evaluation and trend analysis features, which form the core of the application, were successful in providing users with a clearer understanding of their progress. By comparing recent workouts and identifying patterns, the system introduced a level of interpretation that is often missing in traditional fitness apps. That said, this component also exposed the complexity of delivering truly meaningful insights. While the current implementation provides useful feedback, it remains relatively simple and could be expanded to include more advanced predictive models or deeper analysis of long-term trends. This highlights an important realization from the project: building an evaluation system is not just about processing data, but about ensuring that the feedback is both accurate and valuable to the user.
From a user interface perspective, the application achieved its goal of maintaining clean, legible visuals, particularly through the use of SwiftUI and structured chart design. The decision to prioritize simplicity and clarity proved effective, as it made complex data easier to interpret. This also revealed the challenge of balancing simplicity with depth, as more advanced features and visualizations could further enhance the user experience without compromising usability if implemented carefully.
Overall, the project demonstrates that the core idea of combining workout tracking with evaluation and feedback is both feasible and impactful. At the same time, reflecting on the individual components of the system shows that many of the current solutions represent strong foundational implementations rather than final, fully developed features. Each major part of the application—data storage, gamification, evaluation, and visualization—worked well within the scope of the project, but also revealed clear pathways for refinement and expansion. This reflection not only validates the success of the current system but also naturally leads into a discussion of its limitations and potential future improvements.
Limitations of the Current System
While WorkoutTracker successfully achieves its primary goal of providing evaluation and trend analysis, several limitations were identified throughout the development process that impact the system’s scalability, depth, and overall functionality. These limitations are not failures of the system, but rather natural outcomes of design decisions made to prioritize simplicity, performance, and feasibility within the scope of the project.
One of the most significant limitations is the use of local data storage through JSON. Although this approach proved to be efficient and reliable for performance testing and daily usage, it restricts the application to a single device and does not support data synchronization or backup. Users cannot access their data across multiple devices, and there is a risk of data loss if the application is deleted or the device is reset. Additionally, as the dataset grows beyond the tested limits, this storage method may become less efficient compared to more scalable solutions such as cloud-based databases. The local storage was tested with as many as 10,000 pieces of data, but the experiment didn’t tell what would happen past that dataset size.
Another limitation lies within the evaluation system itself. While the application provides useful comparisons and trend analysis, the logic behind these evaluations remains relatively simple. The system primarily relies on recent averages and straightforward comparisons, which may not fully capture more complex patterns in user performance. As a result, the feedback, while helpful, can sometimes lack depth or fail to adapt to more nuanced workout behaviors over time.
The gamification system, particularly the awards feature, also presents limitations. Currently, awards are largely predefined and based on fixed thresholds, such as the number of workouts completed or achieving a personal record. While these awards add motivation and engagement, they are not personalized to the individual user’s habits, goals, or progress patterns. This can reduce their long-term effectiveness, as users may quickly exhaust meaningful milestones or feel that the rewards do not accurately reflect their unique fitness journey.
Similarly, the suggestions feature is limited in its current implementation. The application provides users with lists of exercises organized by muscle group, along with general tips and external video links. While this is useful as a reference tool, it lacks personalization and does not adapt based on the user’s workout history, strengths, or areas needing improvement. As a result, the suggestions function more as static guidance rather than an intelligent recommendation system.
From a user experience standpoint, although the interface is clean and visually effective, there are limitations in interactivity and customization. Charts, while informative, are relatively basic and do not allow for deeper exploration of data, such as filtering by time range or comparing multiple exercises simultaneously. Additionally, users have limited control over how their data is displayed or analyzed, which could restrict the app’s usefulness for more advanced users.
Overall, these limitations highlight that while WorkoutTracker provides a strong foundation for evaluation-focused fitness tracking, many of its current features represent initial implementations rather than fully developed solutions. These constraints naturally point toward opportunities for future enhancements, particularly in areas such as scalability, personalization, and advanced data analysis.
Future Works
Building upon the critical evaluation of WorkoutTracker, several opportunities for future development emerge that have the potential to significantly enhance the application’s functionality, scalability, and overall user experience. While the current system successfully establishes a foundation for evaluation focused fitness tracking, it also highlights areas where deeper personalization, advanced analysis, and expanded features could further differentiate the application. The following proposed improvements are directly informed by the limitations identified in the current system and represent logical next steps in evolving WorkoutTracker into a more intelligent, adaptive, and comprehensive fitness platform.
AI Integration
One of the most ambitious and impactful future enhancements is the integration of artificial intelligence through large language models (LLMs). This feature would allow the application to move beyond static design and evolve into a system that continuously learns from user behavior. By tracking interaction patterns, such as time spent on specific pages, frequently accessed features, and navigation habits, the application could dynamically adjust its layout, recommendations, and emphasis areas to better align with individual user preferences. For example, if a user consistently engages with progress charts and evaluation insights but rarely interacts with the suggestions page, the system could prioritize those analytics on the home screen or streamline access to them. Similarly, if a user frequently logs workouts within a specific muscle group, the app could proactively highlight related trends or recommendations. Over time, this would create a highly personalized experience that adapts as the user’s habits and goals evolve.
The integration of large language models would significantly advance WorkoutTracker. This would allow the application to evolve alongside the user, continuously refining its insights and recommendations without requiring constant manual updates to the underlying logic. As a result, the app would shift toward a more intelligent and autonomous system, capable of delivering increasingly relevant and sophisticated guidance as it accumulates more user data.
This type of adaptive interface represents a exciting future innovation in mobile applications. While modern smartphones are soon to incorporate AI-driven personalization at the system level, such functionality has not yet been deeply integrated into individual fitness applications. Implementing this feature would position WorkoutTracker as a leader in intelligent fitness app design, transforming it from a passive tool into an actively evolving system tailored to each user.
Personalized Gamification and Dynamic Awards System
Another key area for improvement is the expansion of the gamification system, particularly through the introduction of personalized awards and badges. The current implementation relies on predefined milestones, such as total workouts completed or achieving a new personal record. While effective in the short term, this approach lacks long-term adaptability and may not fully reflect each user’s unique fitness journey.
A more advanced system would generate dynamic, user-specific achievements based on individual behavior and progress patterns. For instance, a user who consistently improves repetitions on a certain exercise might receive awards tied to progression for that exercise, while another user focused on strength could earn recognition for incremental increases in lifting performance. Additionally, awards could be tailored to consistency, recovery habits, or even volume metrics provided in the evaluation.
This personalized approach would make the gamification system significantly more engaging and meaningful. Rather than working toward generic milestones, users would feel that the app recognizes and rewards their specific efforts and progress. Over time, this could improve user retention, increase motivation, and create a more immersive and rewarding experience. Developing the app in this way would be exciting as a devloper to see what different awards would be developed. This also opens the area of sharing awards with the WorkoutTracker community or friends to see what unique awards the userbase achieves.
Automated Strength Training Program Generation
A major functional expansion of WorkoutTracker would be the introduction of a personalized strength training program generator. This feature would leverage the user’s historical workout data—collected over an initial period of approximately two to three months—to create a structured and customized training plan. By analyzing frequently performed exercises, weight progression, and muscle group distribution, the system could identify patterns in the user’s training habits and areas for improvement. Using this information, the application could generate a tailored program that builds upon the user’s strengths while addressing potential imbalances. For example, if a user consistently prioritizes upper body exercises but neglects lower body training, the generated program could incorporate more balanced workout splits. This would help a countless number of users recognize their training habits and how to change them in a beneficial way.
The final output could be formatted as a downloadable PDF, providing users with a clear, organized, and portable training plan. This would elevate the application from a tracking and evaluation tool to a more comprehensive fitness solution that actively guides user progression. Additionally, this feature could serve as a bridge between data analysis and actionable outcomes, further reinforcing the app’s core goal of meaningful evaluation.
Cloud-Based Data Storage and Multi-Device Accessibility
To address one of the most significant limitations of the current system, future development should include the implementation of cloud-based data storage. Transitioning from local storage to a shared database would allow users to create accounts and access their workout data across multiple devices, significantly improving usability. This enhancement would enable features such as real-time data synchronization, secure backups, and account-based login systems. Users would no longer be restricted to a single device, reducing the risk of data loss and making the application more practical for long-term use. Additionally, cloud integration would open the door to future features such as social sharing, collaborative training, or community-based challenges.
From a technical standpoint, this would involve integrating backend services such as cloud databases and authentication systems to support secure, persistent, and synchronized data storage. Implementing this architecture would require designing a structured backend that can efficiently handle user accounts, data retrieval, and real time updates across multiple devices. Technologies such as cloud-based databases (Firebase or AWS) would enable scalable data management, while authentication systems would ensure that user information remains secure and accessible only to the appropriate account. Additionally, considerations such as data consistency, and offline functionality would need to be addressed to maintain a smooth user experience. While this introduces additional complexity compared to the current lightweight architecture, it would significantly enhance the system by enabling seamless cross-device access, improved data reliability, and a more flexible foundation for future feature expansion.
Project Impact
WorkoutTracker demonstrates the potential for a shift in how mobile fitness applications support users, moving from data visualization and collection toward active performance evaluation and guidance. By focusing on interpreting workout data rather than simply recording it, the application introduces a more meaningful and user-centered approach to fitness tracking. This has direct implications for user motivation and long lasting adherence, as individuals are more likely to remain consistent when they can clearly understand their progress and receive actionable feedback.
In a broader context, this project highlights an opportunity within the fitness technology space to prioritize personalization and insight generation. Many existing applications provide extensive data but leave interpretation up to the user. WorkoutTracker addresses this gap by simplifying complex information into understandable trends and evaluations, making fitness data more accessible to a wider range of users. Additionally, the concepts explored in this project such as adaptive feedback, personalized recommendations, and intelligent evaluation, can extend beyond fitness into other domains where user-inputted data can be leveraged to improve decision making and engagement.
Overall, the impact of this project lies not only in the functionality of the application itself, but also in its demonstration that relatively lightweight systems can deliver meaningful insights when designed with a clear focus on user needs. It reinforces the idea that the value of an application is not solely in the amount of data it collects, but in how effectively that data is transformed into useful and actionable information.
Final Reflection
Looking back on the development of WorkoutTracker, this project represents both a successful technical implementation and a meaningful personal achievement. It began with a simple but important motivation which was the desire to better understand progress in the gym and to have access to clear, actionable feedback that was not readily available in existing applications. Through the design and development process, this idea evolved into a fully functional system that not only tracks workouts but actively evaluates them.
Throughout this project, I developed a deeper understanding of both software engineering and user-centered design. From structuring data models and optimizing performance to designing intuitive visualizations and feedback systems, each component required thoughtful decision making and iterative improvement. This process also reinforced the importance of balancing simplicity with functionality, as many of the most effective features were those that presented complex information in a clear and accessible way.
Perhaps most importantly, this project demonstrated how a personally motivated problem can lead to a meaningful and impactful solution. By building something that I would genuinely use in my own fitness journey, I was able to maintain a strong focus on usability, relevance, and practicality. Moving forward, this project provides a solid foundation for further development and serves as a reflection of both my technical growth and my ability to design solutions that address real-world needs.